


This publication is Open Access under the license indicated. Learn More
Propionic Acid Outperforms Formic and Acetic Acid in MS Sensitivity for High-Flow Reversed-Phase LC-MS Bottom-Up ProteomicsClick to copy article linkArticle link copied!
- Mykyta R. StarovoitMykyta R. StarovoitDepartment of Analytical Chemistry, Faculty of Pharmacy in Hradec Králové, Charles University, Heyrovského 1203/8, Hradec Králové 500 03, Czech RepublicMore by Mykyta R. Starovoit
- Siddharth JadejaSiddharth JadejaDepartment of Analytical Chemistry, Faculty of Pharmacy in Hradec Králové, Charles University, Heyrovského 1203/8, Hradec Králové 500 03, Czech RepublicMore by Siddharth Jadeja
- Rudolf KupčíkRudolf KupčíkBiomedical Research Centre, University Hospital Hradec Králové, Sokolská 581, Hradec Králové 500 05, Czech RepublicMore by Rudolf Kupčík
- Saša VatićSaša VatićLaboratory of Structural Biology and Cell Signaling, Institute of Microbiology, Czech Academy of Sciences, BioCeV, Vídeňská 1083, Prague 4 142 00, Czech RepublicMore by Saša Vatić
- Jan RaslJan RaslLaboratory of Structural Biology and Cell Signaling, Institute of Microbiology, Czech Academy of Sciences, BioCeV, Vídeňská 1083, Prague 4 142 00, Czech RepublicDepartment of Biochemistry, Faculty of Science, Charles University, Hlavova 6, Prague 2 12843, Czech RepublicMore by Jan Rasl
- Derya DemirDerya DemirDepartment of Analytical Chemistry, Faculty of Pharmacy in Hradec Králové, Charles University, Heyrovského 1203/8, Hradec Králové 500 03, Czech RepublicMore by Derya Demir
- Petr NovákPetr NovákLaboratory of Structural Biology and Cell Signaling, Institute of Microbiology, Czech Academy of Sciences, BioCeV, Vídeňská 1083, Prague 4 142 00, Czech RepublicDepartment of Biochemistry, Faculty of Science, Charles University, Hlavova 6, Prague 2 12843, Czech RepublicMore by Petr Novák
- Cameron BraswellCameron BraswellOrgan Pathobiology and Therapeutics Institute, University of Pittsburgh, Pittsburgh, Pennsylvania 15203, United StatesMore by Cameron Braswell
- Benjamin C. OrsburnBenjamin C. OrsburnOrgan Pathobiology and Therapeutics Institute, University of Pittsburgh, Pittsburgh, Pennsylvania 15203, United StatesMore by Benjamin C. Orsburn
- Juraj Lenčo*Juraj Lenčo*E-mail: [email protected]. Tel: +420 495 067 381.Department of Analytical Chemistry, Faculty of Pharmacy in Hradec Králové, Charles University, Heyrovského 1203/8, Hradec Králové 500 03, Czech RepublicMore by Juraj Lenčo
Analytical Chemistry
© 2026 The Authors. Published by American Chemical Society. This publication is licensed under
License Summary*
You are free to share (copy and redistribute) this article in any medium or format and to adapt (remix, transform, and build upon) the material for any purpose, even commercially within the parameters below:

Creative Commons (CC): This is a Creative Commons license.

Attribution (BY): Credit must be given to the creator.
*Disclaimer
This summary highlights only some of the key features and terms of the actual license. It is not a license and has no legal value. Carefully review the actual license before using these materials.
Abstract
Formic acid has long been the default acidic additive in reversed-phase LC-MS-based bottom-up proteomics, offering a practical balance between chromatographic performance and electrospray ionization (ESI) efficiency. Here, we evaluate propionic acid as an alternative mobile phase acidifier, a candidate that has been largely overlooked in efforts to improve ESI efficiency without compromising chromatography. By reducing both the ionic strength and surface tension of the mobile phase, propionic acid markedly enhanced ESI efficiency, yielding an average 39% increase in peptide identifications compared to formic acid and even a 12% increase relative to the recently revived acetic acid. These gains were consistent across interlaboratory data sets encompassing analytical- and microflow LC-MS configurations, diverse column chemistries, and varying sample complexities. Importantly, chromatographic performance remained virtually unaffected, with only a minor reduction in peptide retention. The mobile phase containing propionic acid was stable, instrument-compatible, and introduced a negligible background signal. Collectively, these findings challenge the long-standing reliance on formic acid and establish propionic acid as a robust, drop-in alternative for high-flow LC-MS workflows prioritizing MS sensitivity and proteome depth.
This publication is licensed under
License Summary*
You are free to share(copy and redistribute) this article in any medium or format and to adapt(remix, transform, and build upon) the material for any purpose, even commercially within the parameters below:
Creative Commons (CC): This is a Creative Commons license.
Attribution (BY): Credit must be given to the creator.
*Disclaimer
This summary highlights only some of the key features and terms of the actual license. It is not a license and has no legal value. Carefully review the actual license before using these materials.
Experimental Section
Chemicals and Reagents
Instruments
Effects of Propionic Acid on Analyses of Model Peptides
Effects of Propionic Acid on Peptide Mapping of Monoclonal Antibody
Effects of Propionic Acid on Analytical- and Microflow Analyses of Complex Samples
Effects of Propionic Acid on Nanoflow Analyses of Complex Samples
Instrument Compatibility and Mobile Phase Stability
Results and Discussion
Theoretical Considerations
| Pure acid | TFA | FA | AcA | PrA |
|---|---|---|---|---|
| pKa | 0.23 | 3.75 | 4.76 | 4.88 |
| Surface tension at 25 °C, mN/m (44,45) | 13.5 | 37.0 | 27.1 | 26.2 |
| Boiling point, °C | 72.4 | 100.7 | 118.1 | 141.2 |
| Vapor pressure at 20 °C, mmHg (46) | 82.5 | 34.5 | 11.2 | 2.9 |
| Solution (v/v) | 0.1% TFA | 0.1% FA | 0.01% FA | 0.5% AcA | 0.5% PrA |
|---|---|---|---|---|---|
| pH | 1.9 | 2.7 | 3.2 | 2.9 | 3.0 |
| Molarity, mM | 13.1 | 26.5 | 2.6 | 87.4 | 67.0 |
| Anion concentration, mM | 12.8 | 2.1 | 0.5 | 1.2 | 0.9 |
Effects of Propionic Acid on Analyses of Model Peptides
Figure 1
Figure 1. Relative change of total precursor MS intensity and retention time (tR) of peptides from iRT and Alberta sets separated using a 2.1 × 150 mm Acquity Premier CSH C18 column and mobile phase containing 0.5% AcA or 0.5% PrA in comparison to the separation using 0.1% FA. The iRT peptides are listed from left to right in the order of increasing isoelectric point. The number of protonated amino groups is indicated for Alberta peptides. For iRT and Alberta peptide properties, see Figure S1.
Effects of Propionic Acid on Peptide Mapping of Monoclonal Antibody
Figure 2
Figure 2. (A) Base peak chromatograms of 1 μg of bevacizumab peptides separated within a 20 min gradient using the 2.1 × 150 mm Acquity Premier CSH C18 column maintained at 60 °C and mobile phase containing FA, AcA, or PrA. (B) Total identified peptides in analyses of five sample inputs using three additives. Database search was performed with semitryptic specificity, allowing up to two missed cleavages. (C) Distribution of relative change of peak area (AUC), tR, and peak width at half height (w0.5) of 44 representative peptides normalized to those observed using FA-containing mobile phase. The peak areas of all identified precursors were summed. The mean and standard deviation from duplicates are illustrated. (D) Dependence of tR change on peptide isoelectric point (pI) when switching to AcA and PrA from FA with linear regressions. The equations of the linear regression, determination coefficients, and Pearson correlation coefficients are shown below. The retention times of 38 unmodified peptides were evaluated. Colored dots illustrate 90% prediction bands.
Figure 3
Figure 3. Relative abundance of the modified peptide forms in the 20 and 90 min separations of bevacizumab peptides using the 2.1 × 150 mm Acquity Premier CSH C18 column maintained at 60 and 80 °C. The abundance was calculated as the peak area of all the precursors of the modified peptide divided by the summed area of both peptide forms. The most abundant modified peptide containing the modified amino acid was used. Abbreviations: Lc – light chain, Hc – heavy chain. The superscripted numbers correspond to the position of the modified amino acid in the chain sequence.
Effects of Propionic Acid on Analytical- and Microflow Analyses of Complex Samples
Figure 4
Figure 4. (A) Relative increase in the number of identified peptides from various sample inputs of digested Jurkat cell proteins separated within a 60 min gradient using the 1.0 × 150 mm Acquity UPLC CSH C18 column maintained at 60 °C and mobile phases containing AcA and PrA in comparison to FA. An average number of peptides identified under the FA conditions is highlighted above. (B) Relative increase in identifications in analyses using different columns. Data set descriptions include stationary phase ligand, internal column diameter, and sample load. A plus sign indicates a positively charged surface of the stationary phase. (C) Ratios of peptide identifications in the experiment involving the trap-elute configuration. Abbreviations: ret – fraction of peptides retained in the trap column during a 2 min isocratic loading step and analyzed in the subsequent blank injection, nonret – fraction of peptides that eluted from the trap column during the loading step, and ctrl – number of identifications using direct injection of peptides into the separation column through a bypass capillary. (D) Relative change of tR and w0.5 of 400 peptides from digested Jurkat cell proteins analyzed on different columns using mobile phases containing AcA and PrA relative to FA. The mean and standard deviation are illustrated. Peptides were randomly selected from each column data set separately. The spectra were manually revised to ensure correct peak selection and integration. The numbers above correspond to average w0.5 (s) in the FA data sets.
Effects of Propionic Acid on Nanoflow Analyses of Complex Samples
Figure 5
Figure 5. Relative change in the number of identified peptides in nanoflow analyses of various sample inputs separated using a mobile phase containing AcA or PrA in comparison to FA. An average number of peptides identified under the FA conditions is highlighted above. Results from three research facilities exploiting Orbitrap Exploris 480 (BRC), timsTOF Ultra 2 (OPTIn), and timsTOF SCP (IMB) mass spectrometers are illustrated.
Instrument Compatibility and Mobile Phase Stability
Conclusion
Supporting Information
The Supporting Information is available free of charge at https://pubs.acs.org/doi/10.1021/acs.analchem.5c07595.
Sample preparation (Note S1); search parameters for bottom-up LC-MS data (Note S2); GC-MS profiling (Note S3); ion source settings (Table S1); settings of MS1 and DDA/DIA experiments (Table S2); concentration (ppb) of elements influenced by the selection of acidifier (Table S3); effects of alternative additives on peak width, charge distribution, and base peak intensity of model peptides (Figure S1); abundance of precursor charge states in peptide mapping of monoclonal antibody (Figure S2); peptide hydrophobicity- and pI-dependent change of AUC (Figure S3); effects of adding DMSO to PrA-containing mobile phase on total ion current and charge distribution in microflow analyses (Figure S4); peptide hydrophobicity-dependent change of retention time (Figure S5); dependence of retention behavior on peptide pI (Figure S6); dependence of peak broadening on peptide hydrophobicity in separation using HALO column (Figure S7); effects of alternative additives on peptide modification rate in the analysis of complex sample (Figure S8); relative concentrations of elements in treated mobile phase samples (Figure S9); effect of alternative additives on MS background noise (Figure S10) (PDF)
Terms & Conditions
Most electronic Supporting Information files are available without a subscription to ACS Web Editions. Such files may be downloaded by article for research use (if there is a public use license linked to the relevant article, that license may permit other uses). Permission may be obtained from ACS for other uses through requests via the RightsLink permission system: http://pubs.acs.org/page/copyright/permissions.html.
Author Information
- Juraj Lenčo - Department of Analytical Chemistry, Faculty of Pharmacy in Hradec Králové, Charles University, Heyrovského 1203/8, Hradec Králové 500 03, Czech Republic;
 https://orcid.org/0000-0002-8526-9249;
- Petr Novák - Laboratory of Structural Biology and Cell Signaling, Institute of Microbiology, Czech Academy of Sciences, BioCeV, Vídeňská 1083, Prague 4 142 00, Czech Republic; Department of Biochemistry, Faculty of Science, Charles University, Hlavova 6, Prague 2 12843, Czech Republic;https://orcid.org/0000-0001-8688-529X
- Benjamin C. Orsburn - Organ Pathobiology and Therapeutics Institute, University of Pittsburgh, Pittsburgh, Pennsylvania 15203, United States;https://orcid.org/0000-0002-0774-3750
M.R.S.: experiments, investigation, methodology, data analysis, writing – original draft, review and editing, data deposition. S.J.: experiments, investigation, funding acquisition, methodology, data analysis. R.K.: experiments, investigation, methodology, data analysis. S.V.: experiments, data deposition. J.R.: experiments, data analysis. D.D.: experiments. P.N.: methodology, data analysis, investigation, supervision. C.B.: experiments, data analysis, methodology. B.C.O.: methodology, data analysis, investigation, supervision, data deposition. J.L.: conceptualization, funding acquisition, supervision, formal analysis, review and editing. The manuscript was written through the contributions of all authors. All authors have given approval to the final version of the manuscript. M.R.S. and S.J. contributed equally to this work.
The authors gratefully acknowledge the financial support of the Project of the Czech Science Foundation (GAČR) (22-21620S), the Project of the Charles University Grant Agency (GAUK) (370522), the SVV Project (260782), the project New Technologies for Translational Research in Pharmaceutical Sciences (NETPHARM, CZ.02.01.01/00/22_008/0004607) cofunded by the European Union, and the project of the Ministry of Health of Czech Republic – conceptual development of research organization (UHHK) (00179906). At OPTIn, the work was supported by the US National Institute on Aging (R01AG064908, BCO) and startup funds from the University of Pittsburgh School of Medicine. The IMB team was funded by the National Institute for Neurological Research (Programme EXCELES) (LX22NPO5107) and the MEYS/EU project OP JAK – INTER-MICRO (CZ.02.01.01/00/22_008/0004597).
Acknowledgments
We thank Jaroslav Jenčo (FPh) and Lenka Husáková (Department of Analytical Chemistry, University of Pardubice, Czech Republic) for performing GC-MS and ICP-MS analyses. Access to the Instruct-CZ center (BioCeV) was supported by CIISB (LM2023042 and CZ.02.01.01/00/23_015/0008175).
| AcA | acetic acid |
| ACN | acetonitrile |
| AUC | area under curve |
| BRC | Biomedical Research Center |
| DMSO | dimethyl sulfoxide |
| ESI | electrospray ionization |
| FA | formic acid |
| FEP | fluorinated ethylene propylene |
| FPh | Faculty of Pharmacy in Hradec Králové |
| i.d. | internal diameter |
| IMB | Institute of Microbiology of the Czech Academy of Sciences in Prague |
| OPTIn | Organ Pathobiology and Therapeutics Institute, University of Pittsburgh |
| PrA | propionic acid |
| TFA | trifluoroacetic acid |
References
This article references 67 other publications.
- 1Zhang, Z.; Wu, S.; Stenoien, D. L.; Pasa-Tolic, L. High-throughput proteomics. Annu. Rev. Anal Chem 2014, 7, 427– 454, DOI: 10.1146/annurev-anchem-071213-020216Google ScholarThere is no corresponding record for this reference.
- 2Aebersold, R.; Mann, M. Mass-spectrometric exploration of proteome structure and function. Nature 2016, 537, 347– 355, DOI: 10.1038/nature19949Google ScholarThere is no corresponding record for this reference.
- 3Ishihama, Y. Proteomic LC-MS systems using nanoscale liquid chromatography with tandem mass spectrometry. J. Chromatogr. A 2005, 1067, 73– 83, DOI: 10.1016/j.chroma.2004.10.107Google ScholarThere is no corresponding record for this reference.
- 4McCalley, D. V. Effect of buffer on peak shape of peptides in reversed-phase high performance liquid chromatography. J. Chromatogr. A 2004, 1038, 77– 84, DOI: 10.1016/j.chroma.2004.03.038Google ScholarThere is no corresponding record for this reference.
- 5Issaq, H. J.; Fox, S. D.; Mahadevan, M.; Conrads, T. P.; Veenstra, T. D. Effect of experimental parameters on the HPLC separation of peptides and proteins. J. Liq. Chromatogr. Relat. Technol. 2003, 26, 2255– 2283, DOI: 10.1081/JLC-120023246Google ScholarThere is no corresponding record for this reference.
- 6Guo, D. C.; Mant, C. T.; Hodges, R. S. Effects of ion-pairing reagents on the prediction of peptide retention in reversed-phase high-performance liquid chromatography. J. Chromatogr. A 1987, 386, 205– 222, DOI: 10.1016/S0021-9673(01)94598-4Google ScholarThere is no corresponding record for this reference.
- 7Khalikova, M. A.; Skarbalius, L.; Naplekov, D. K.; Jadeja, S.; Svec, F.; Lenco, J. Evaluation of strategies for overcoming trifluoroacetic acid ionization suppression resulted in single-column intact level, middle-up, and bottom-up reversed-phase LC-MS analyses of antibody biopharmaceuticals. Talanta 2021, 233, 122512, DOI: 10.1016/j.talanta.2021.122512Google ScholarThere is no corresponding record for this reference.
- 8Garcia, M. C. The effect of the mobile phase additives on sensitivity in the analysis of peptides and proteins by high-performance liquid chromatography-electrospray mass spectrometry. J. Chromatogr. B 2005, 825, 111– 123, DOI: 10.1016/j.jchromb.2005.03.041Google ScholarThere is no corresponding record for this reference.
- 9Apffel, A.; Fischer, S.; Goldberg, G.; Goodley, P. C.; Kuhlmann, F. E. Enhanced sensitivity for peptide mapping with electrospray liquid chromatography-mass spectrometry in the presence of signal suppression due to trifluoroacetic acid-containing mobile phases. J. Chromatogr. A 1995, 712, 177– 190, DOI: 10.1016/0021-9673(95)00175-MGoogle ScholarThere is no corresponding record for this reference.
- 10Kuhlmann, F. E.; Apffel, A.; Fischer, S. M.; Goldberg, G.; Goodley, P. C. Signal enhancement for gradient reverse-phase high-performance liquid chromatography-electrospray ionization mass spectrometry analysis with trifluoroacetic and other strong acid modifiers by postcolumn addition of propionic acid and isopropanol. J. Am. Soc. Mass Spectrom 1995, 6, 1221– 1225, DOI: 10.1016/1044-0305(95)00571-4Google ScholarThere is no corresponding record for this reference.
- 11Lauber, M. A.; Koza, S. M.; McCall, S. A.; Alden, B. A.; Iraneta, P. C.; Fountain, K. J. High-resolution peptide mapping separations with MS-friendly mobile phases and charge-surface-modified C18. Anal. Chem 2013, 85, 6936– 6944, DOI: 10.1021/ac401481zGoogle ScholarThere is no corresponding record for this reference.
- 12Kadlecova, Z.; Kozlik, P.; Tesarova, E.; Gilar, M.; Kalikova, K. Characterization and comparison of mixed-mode and reversed-phase columns; interaction abilities and applicability for peptide separation. J. Chromatogr. A 2021, 1648, 462182, DOI: 10.1016/j.chroma.2021.462182Google ScholarThere is no corresponding record for this reference.
- 13Jadeja, S.; Kupcik, R.; Fabrik, I.; Sklenarova, H.; Lenco, J. A stationary phase with a positively charged surface allows for minimizing formic acid concentration in the mobile phase, enhancing electrospray ionization in LC-MS proteomic experiments. Analyst 2023, 148, 5980– 5990, DOI: 10.1039/D3AN01508DGoogle ScholarThere is no corresponding record for this reference.
- 14Jadeja, S.; Karsakov, A. A.; Sklenarova, H.; Lenco, J. Evaluating C(18) stationary phases with a positively charged surface for proteomic LC-MS applications using mobile phase acidified with reduced formic acid concentration. J. Chromatogr. A 2024, 1730, 465142, DOI: 10.1016/j.chroma.2024.465142Google ScholarThere is no corresponding record for this reference.
- 15Battellino, T.; Ogata, K.; Spicer, V.; Ishihama, Y.; Krokhin, O. Acetic Acid Ion Pairing Additive for Reversed-Phase HPLC Improves Detection Sensitivity in Bottom-up Proteomics Compared to Formic Acid. J. Proteome Res 2023, 22, 272– 278, DOI: 10.1021/acs.jproteome.2c00388Google ScholarThere is no corresponding record for this reference.
- 16Lenco, J.; Vajrychova, M.; Pimkova, K.; Proksova, M.; Benkova, M.; Klimentova, J.; Tambor, V.; Soukup, O. Conventional-Flow Liquid Chromatography-Mass Spectrometry for Exploratory Bottom-Up Proteomic Analyses. Anal. Chem 2018, 90, 5381– 5389, DOI: 10.1021/acs.analchem.8b00525Google ScholarThere is no corresponding record for this reference.
- 17Huber, C. G.; Premstaller, A. Evaluation of volatile eluents and electrolytes for high-performance liquid chromatography-electrospray ionization mass spectrometry and capillary electrophoresis-electrospray ionization mass spectrometry of proteins. I. Liquid chromatography. J. Chromatogr. A 1999, 849, 161– 173, DOI: 10.1016/S0021-9673(99)00532-4Google ScholarThere is no corresponding record for this reference.
- 18Garcia, M. C.; Hogenboom, A. C.; Zappey, H.; Irth, H. Effect of the mobile phase composition on the separation and detection of intact proteins by reversed-phase liquid chromatography-electrospray mass spectrometry. J. Chromatogr. A 2002, 957, 187– 199, DOI: 10.1016/S0021-9673(02)00345-XGoogle ScholarThere is no corresponding record for this reference.
- 19Wang, S.; Xing, T.; Liu, A. P.; He, Z.; Yan, Y.; Daly, T. J.; Li, N. Simple Approach for Improved LC-MS Analysis of Protein Biopharmaceuticals via Modification of Desolvation Gas. Anal. Chem 2019, 91, 3156– 3162, DOI: 10.1021/acs.analchem.8b05846Google ScholarThere is no corresponding record for this reference.
- 20Li, Z.; Li, L. Chemical-vapor-assisted electrospray ionization for increasing analyte signals in electrospray ionization mass spectrometry. Anal. Chem 2014, 86, 331– 335, DOI: 10.1021/ac4036263Google ScholarThere is no corresponding record for this reference.
- 21Starovoit, M. R.; Jadeja, S.; Gazarkova, T.; Lenco, J. Mitigating In-Column Artificial Modifications in High-Temperature LC-MS for Bottom-Up Proteomics and Quality Control of Protein Biopharmaceuticals. Anal. Chem 2024, 96, 14531– 14540, DOI: 10.1021/acs.analchem.4c02819Google ScholarThere is no corresponding record for this reference.
- 22Pedroso, E.; Grandas, A.; Amor, J. C.; Giralt, E. Reversed-phase high-performance liquid chromatography of protected peptide segments. J. Chromatogr 1987, 409, 281– 290, DOI: 10.1016/S0021-9673(01)86804-7Google ScholarThere is no corresponding record for this reference.
- 23Shou, W. Z.; Naidong, W. Simple means to alleviate sensitivity loss by trifluoroacetic acid (TFA) mobile phases in the hydrophilic interaction chromatography-electrospray tandem mass spectrometric (HILIC-ESI/MS/MS) bioanalysis of basic compounds. J. Chromatogr. B 2005, 825, 186– 192, DOI: 10.1016/j.jchromb.2005.01.011Google ScholarThere is no corresponding record for this reference.
- 24Bjorneholm, O.; Ohrwall, G.; de Brito, A. N.; Agren, H.; Carravetta, V. Superficial Tale of Two Functional Groups: On the Surface Propensity of Aqueous Carboxylic Acids, Alkyl Amines, and Amino Acids. Acc. Chem. Res 2022, 55, 3285– 3293, DOI: 10.1021/acs.accounts.2c00494Google ScholarThere is no corresponding record for this reference.
- 25Eberhard, C. D.; Braswell, C.; Orsburn, B. C. Alternative Ion-Pairing Modifiers Should Be Investigated in Low-Input and Single-Cell Proteomics. J. Proteome Res. 2025, 24 (12), 6338– 6343, DOI: 10.1021/acs.jproteome.5c00930Google ScholarThere is no corresponding record for this reference.
- 26Deutsch, E. W. The ProteomeXchange consortium at 10 years: 2023 update. Nucleic Acids Res 2023, 51, D1539– D1548, DOI: 10.1093/nar/gkac1040Google ScholarThere is no corresponding record for this reference.
- 27MacLean, B.; Tomazela, D. M.; Shulman, N.; Chambers, M.; Finney, G. L.; Frewen, B.; Kern, R.; Tabb, D. L.; Liebler, D. C.; MacCoss, M. J. Skyline: an open source document editor for creating and analyzing targeted proteomics experiments. Bioinformatics 2010, 26, 966– 968, DOI: 10.1093/bioinformatics/btq054Google ScholarThere is no corresponding record for this reference.
- 28Kozlowski, L. P. IPC 2.0: prediction of isoelectric point and pKa dissociation constants. Nucleic Acids Res 2021, 49, W285– W292, DOI: 10.1093/nar/gkab295Google ScholarThere is no corresponding record for this reference.
- 29Lenco, J.; Semlej, T.; Khalikova, M. A.; Fabrik, I.; Svec, F. Sense and Nonsense of Elevated Column Temperature in Proteomic Bottom-up LC-MS Analyses. J. Proteome Res 2021, 20, 420– 432, DOI: 10.1021/acs.jproteome.0c00479Google ScholarThere is no corresponding record for this reference.
- 30Jadeja, S.; Naplekov, D. K.; Starovoit, M. R.; Plachka, K.; Ritchie, H.; Lawhorn, J.; Sklenarova, H.; Lenco, J. Microflow LC-MS Bottom-Up Proteomics Using 1.5 mm Internal Diameter Columns. ACS Omega 2025, 10, 4094– 4101, DOI: 10.1021/acsomega.4c10591Google ScholarThere is no corresponding record for this reference.
- 31Bian, Y.; Zheng, R.; Bayer, F. P.; Wong, C.; Chang, Y.-C.; Meng, C.; Zolg, D. P.; Reinecke, M.; Zecha, J.; Wiechmann, S. Robust, reproducible and quantitative analysis of thousands of proteomes by micro-flow LC–MS/MS. Nat. Commun 2020, 11, 157, DOI: 10.1038/s41467-019-13973-xGoogle ScholarThere is no corresponding record for this reference.
- 32Varra, M. O.; Husakova, L.; Patocka, J.; Ghidini, S.; Zanardi, E. Multi-element signature of cuttlefish and its potential for the discrimination of different geographical provenances and traceability. Food Chem 2021, 356, 129687, DOI: 10.1016/j.foodchem.2021.129687Google ScholarThere is no corresponding record for this reference.
- 33US EPA. Method 8270D: semivolatile Organic Compounds by Gas Chromatography/Mass Spectrometry. US EPA 2007.Google ScholarThere is no corresponding record for this reference.
- 34Thermo Scientific. Acclaim Organic Acid (OA) columns: for separation of hydrophilic aliphatic and aromatic organic acids. Thermo Scientific 2020.Google ScholarThere is no corresponding record for this reference.
- 35Smith, K. L.; Alexander, M. S.; Stark, J. P. W. The role of molar conductivity in electrospray cone-jet mode current scaling. J. Appl. Phys 2006, 100, 014905, DOI: 10.1063/1.2210169Google ScholarThere is no corresponding record for this reference.
- 36Beaudry, F.; Vachon, P. Electrospray ionization suppression, a physical or a chemical phenomenon?. Biomed. Chromatogr 2006, 20, 200– 205, DOI: 10.1002/bmc.553Google ScholarThere is no corresponding record for this reference.
- 37Taylor, G. I. Disintegration of water drops in an electric field. Proc. R. Soc. Lond. A. Math. Phys. Sci. 1964, 280, 383– 397, DOI: 10.1098/rspa.1964.0151Google ScholarThere is no corresponding record for this reference.
- 38Ganancalvo, A. M.; Lasheras, J. C.; Davila, J.; Barrero, A. The Electrostatic Spray Emitted from an Electrified Conical Meniscus. J. Aerosol Sci 1994, 25, 1121– 1142, DOI: 10.1016/0021-8502(94)90205-4Google ScholarThere is no corresponding record for this reference.
- 39de la Mora, J. F. The fluid dynamics of Taylor cones. Annu. Rev. Fluid. Mech 2007, 39, 217– 243, DOI: 10.1146/annurev.fluid.39.050905.110159Google ScholarThere is no corresponding record for this reference.
- 40Kebarle, P.; Tang, L. From ions in solution to ions in the gas phase - the mechanism of electrospray mass spectrometry. Anal. Chem 1993, 65, 972A– 986A, DOI: 10.1021/ac00070a001Google ScholarThere is no corresponding record for this reference.
- 41Constantopoulos, T. L.; Jackson, G. S.; Enke, C. G. Effects of salt concentration on analyte response using electrospray ionization mass spectrometry. J. Am. Soc. Mass Spectrom 1999, 10, 625– 634, DOI: 10.1016/S1044-0305(99)00031-8Google ScholarThere is no corresponding record for this reference.
- 42Enke, C. G. A predictive model for matrix and analyte effects in electrospray ionization of singly-charged ionic analytes. Anal. Chem 1997, 69, 4885– 4893, DOI: 10.1021/ac970095wGoogle ScholarThere is no corresponding record for this reference.
- 43Rayleigh, L. XX. On the equilibrium of liquid conducting masses charged with electricity. The London, Edinburgh, and Dublin Philosophical Magazine and Journal of Science; Taylor & Francis, 1882; 14, 184– 186 DOI: 10.1080/14786448208628425Google ScholarThere is no corresponding record for this reference.
- 44Jasper, J. J.; Wedlick, H. L. Effect of temperature on the surface tension and density of trifluoroacetic acid. J. Chem. Eng. Data 1964, 9, 446– 447, DOI: 10.1021/je60022a049Google ScholarThere is no corresponding record for this reference.
- 45Alvarez, E.; Vazquez, G.; SanchezVilas, M.; Sanjurjo, B.; Navaza, J. M. Surface tension of organic acids plus water binary mixtures from 20 degrees C to 50 degrees C. J. Chem. Eng. Data 1997, 42, 957– 960, DOI: 10.1021/je970025mGoogle ScholarThere is no corresponding record for this reference.
- 46International Labour Organization; World Health Organization. International Chemical Safety Cards (1673, 0485, 0363, 0806); International Labour Organization; World Health Organization, 2017.Google ScholarThere is no corresponding record for this reference.
- 47Smith, J. N.; Flagan, R. C.; Beauchamp, J. L. Droplet evaporation and discharge dynamics in electrospray ionization. J. Phys. Chem. A 2002, 106, 9957– 9967, DOI: 10.1021/jp025723eGoogle ScholarThere is no corresponding record for this reference.
- 48Sterling, H. J.; Daly, M. P.; Feld, G. K.; Thoren, K. L.; Kintzer, A. F.; Krantz, B. A.; Williams, E. R. Effects of supercharging reagents on noncovalent complex structure in electrospray ionization from aqueous solutions. J. Am. Soc. Mass Spectrom 2010, 21, 1762– 1774, DOI: 10.1016/j.jasms.2010.06.012Google ScholarThere is no corresponding record for this reference.
- 49Iavarone, A. T.; Williams, E. R. Mechanism of charging and supercharging molecules in electrospray ionization. J. Am. Chem. Soc 2003, 125, 2319– 2327, DOI: 10.1021/ja021202tGoogle ScholarThere is no corresponding record for this reference.
- 50Escher, C.; Reiter, L.; MacLean, B.; Ossola, R.; Herzog, F.; Chilton, J.; MacCoss, M. J.; Rinner, O. Using iRT, a normalized retention time for more targeted measurement of peptides. Proteomics 2012, 12, 1111– 1121, DOI: 10.1002/pmic.201100463Google ScholarThere is no corresponding record for this reference.
- 51Mant, C. T.; Hodges, R. S. Context-dependent effects on the hydrophilicity/hydrophobicity of side-chains during reversed-phase high-performance liquid chromatography: Implications for prediction of peptide retention behaviour. J. Chromatogr. A 2006, 1125, 211– 219, DOI: 10.1016/j.chroma.2006.05.063Google ScholarThere is no corresponding record for this reference.
- 52Lenco, J.; Jadeja, S.; Naplekov, D. K.; Krokhin, O. V.; Khalikova, M. A.; Chocholous, P.; Urban, J.; Broeckhoven, K.; Novakova, L.; Svec, F. Reversed-Phase Liquid Chromatography of Peptides for Bottom-Up Proteomics: A Tutorial. J. Proteome Res 2022, 21, 2846– 2892, DOI: 10.1021/acs.jproteome.2c00407Google ScholarThere is no corresponding record for this reference.
- 53Hahne, H.; Pachl, F.; Ruprecht, B.; Maier, S. K.; Klaeger, S.; Helm, D.; Medard, G.; Wilm, M.; Lemeer, S.; Kuster, B. DMSO enhances electrospray response, boosting sensitivity of proteomic experiments. Nat. Methods 2013, 10, 989– 991, DOI: 10.1038/nmeth.2610Google ScholarThere is no corresponding record for this reference.
- 54Gussakovsky, D.; Anderson, G.; Spicer, V.; Krokhin, O. V. Peptide separation selectivity in proteomics LC-MS experiments: Comparison of formic and mixed formic/heptafluorobutyric acids ion-pairing modifiers. J. Sep. Sci 2020, 43, 3830– 3839, DOI: 10.1002/jssc.202000578Google ScholarThere is no corresponding record for this reference.
- 55Mitulovic, G.; Smoluch, M.; Chervet, J. P.; Steinmacher, I.; Kungl, A.; Mechtler, K. An improved method for tracking and reducing the void volume in nano HPLC-MS with micro trapping columns. Anal. Bioanal. Chem 2003, 376, 946– 951, DOI: 10.1007/s00216-003-2047-2Google ScholarThere is no corresponding record for this reference.
- 56Abele, M.; Soleymaniniya, A.; Bayer, F. P.; Lomp, N.; Doll, E.; Meng, C.; Neuhaus, K.; Scherer, S.; Wenning, M.; Wantia, N. Proteomic Diversity in Bacteria: Insights and Implications for Bacterial Identification. Mol. Cell. Proteomics 2025, 24, 100917, DOI: 10.1016/j.mcpro.2025.100917Google ScholarThere is no corresponding record for this reference.
- 57Szyrwiel, L.; Gille, C.; Mülleder, M.; Demichev, V.; Ralser, M. Fast proteomics with dia-PASEF and analytical flow-rate chromatography. Proteomics 2024, 24, 2300100, DOI: 10.1002/pmic.202300100Google ScholarThere is no corresponding record for this reference.
- 58Wilm, M.; Mann, M. Analytical properties of the nanoelectrospray ion source. Anal. Chem 1996, 68, 1– 8, DOI: 10.1021/ac9509519Google ScholarThere is no corresponding record for this reference.
- 59Juraschek, R.; Dülcks, T.; Karas, M. Nanoelectrospray─More than just a minimized-flow electrospray ionization source. J. Am. Soc. Mass. Spectrom. 1999, 10, 300– 308, DOI: 10.1016/S1044-0305(98)00157-3Google ScholarThere is no corresponding record for this reference.
- 60Konermann, L.; Ahadi, E.; Rodriguez, A. D.; Vahidi, S. Unraveling the Mechanism of Electrospray Ionization. Anal. Chem 2013, 85, 2– 9, DOI: 10.1021/ac302789cGoogle ScholarThere is no corresponding record for this reference.
- 61Markert, C.; Thinius, M.; Lehmann, L.; Heintz, C.; Stappert, F.; Wissdorf, W.; Kersten, H.; Benter, T.; Schneider, B. B.; Covey, T. R. Observation of charged droplets from electrospray ionization (ESI) plumes in API mass spectrometers. Anal. Bioanal. Chem 2021, 413, 5587– 5600, DOI: 10.1007/s00216-021-03452-yGoogle ScholarThere is no corresponding record for this reference.
- 62Xia, Z. J.; Williams, E. R. Effect of droplet lifetime on where ions are formed in electrospray ionization. Analyst 2019, 144, 237– 248, DOI: 10.1039/C8AN01824CGoogle ScholarThere is no corresponding record for this reference.
- 63Olsen, J. V.; de Godoy, L. M.; Li, G.; Macek, B.; Mortensen, P.; Pesch, R.; Makarov, A.; Lange, O.; Horning, S.; Mann, M. Parts per million mass accuracy on an Orbitrap mass spectrometer via lock mass injection into a C-trap. Mol. Cell. Proteomics 2005, 4, 2010– 2021, DOI: 10.1074/mcp.T500030-MCP200Google ScholarThere is no corresponding record for this reference.
- 64Monnin, C.; Ramrup, P.; Daigle-Young, C.; Vuckovic, D. Improving negative liquid chromatography/electrospray ionization mass spectrometry lipidomic analysis of human plasma using acetic acid as a mobile-phase additive. Rapid Commun. Mass Spectrom 2018, 32, 201– 211, DOI: 10.1002/rcm.8024Google ScholarThere is no corresponding record for this reference.
- 65Song, W. Y.; Park, H.; Kim, T. Y. Improving liquid chromatography-mass spectrometry sensitivity for characterization of lignin oligomers and phenolic compounds using acetic acid as a mobile phase additive. J. Chromatogr. A 2022, 1685, 463598, DOI: 10.1016/j.chroma.2022.463598Google ScholarThere is no corresponding record for this reference.
- 66Engelhardt, H.; Lobert, T. Chromatographic determination of metallic impurities in reversed-phase HPLC columns. Anal. Chem 1999, 71, 1885– 1892, DOI: 10.1021/ac981198xGoogle ScholarThere is no corresponding record for this reference.
- 67Ijames, C. F.; Dutky, R. C.; Fales, H. M. Iron carboxylate oxygen-centered-triangle complexes detected during electrospray use of organic acid modifiers with a comment on the finnigan TSQ-700 electrospray inlet system. J. Am. Soc. Mass Spectrom 1995, 6, 1226– 1231, DOI: 10.1016/1044-0305(95)00579-XGoogle ScholarThere is no corresponding record for this reference.
Cited By
This article has not yet been cited by other publications.

Analytical Chemistry
© 2026 The Authors. Published by American Chemical Society. This publication is licensed under
License Summary*
You are free to share (copy and redistribute) this article in any medium or format and to adapt (remix, transform, and build upon) the material for any purpose, even commercially within the parameters below:
Creative Commons (CC): This is a Creative Commons license.
Attribution (BY): Credit must be given to the creator.
*Disclaimer
This summary highlights only some of the key features and terms of the actual license. It is not a license and has no legal value. Carefully review the actual license before using these materials.
Article Views
Altmetric
Citations
Article Views are the COUNTER-compliant sum of full text article downloads since November 2008 (both PDF and HTML) across all institutions and individuals. These metrics are regularly updated to reflect usage leading up to the last few days.
Citations are the number of other articles citing this article, calculated by Crossref and updated daily. Find more information about Crossref citation counts.
The Altmetric Attention Score is a quantitative measure of the attention that a research article has received online. Clicking on the donut icon will load a page at altmetric.com with additional details about the score and the social media presence for the given article. Find more information on the Altmetric Attention Score and how the score is calculated.
Recommended Articles
Abstract
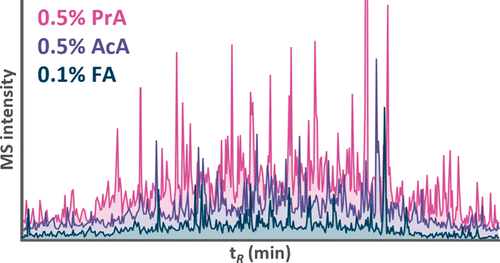
Figure 1
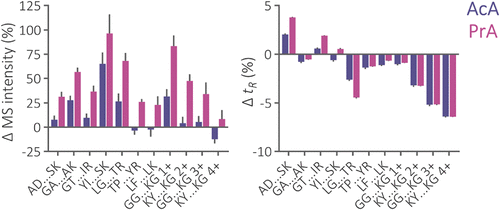
Figure 1. Relative change of total precursor MS intensity and retention time (tR) of peptides from iRT and Alberta sets separated using a 2.1 × 150 mm Acquity Premier CSH C18 column and mobile phase containing 0.5% AcA or 0.5% PrA in comparison to the separation using 0.1% FA. The iRT peptides are listed from left to right in the order of increasing isoelectric point. The number of protonated amino groups is indicated for Alberta peptides. For iRT and Alberta peptide properties, see Figure S1.
Figure 2

Figure 2. (A) Base peak chromatograms of 1 μg of bevacizumab peptides separated within a 20 min gradient using the 2.1 × 150 mm Acquity Premier CSH C18 column maintained at 60 °C and mobile phase containing FA, AcA, or PrA. (B) Total identified peptides in analyses of five sample inputs using three additives. Database search was performed with semitryptic specificity, allowing up to two missed cleavages. (C) Distribution of relative change of peak area (AUC), tR, and peak width at half height (w0.5) of 44 representative peptides normalized to those observed using FA-containing mobile phase. The peak areas of all identified precursors were summed. The mean and standard deviation from duplicates are illustrated. (D) Dependence of tR change on peptide isoelectric point (pI) when switching to AcA and PrA from FA with linear regressions. The equations of the linear regression, determination coefficients, and Pearson correlation coefficients are shown below. The retention times of 38 unmodified peptides were evaluated. Colored dots illustrate 90% prediction bands.
Figure 3
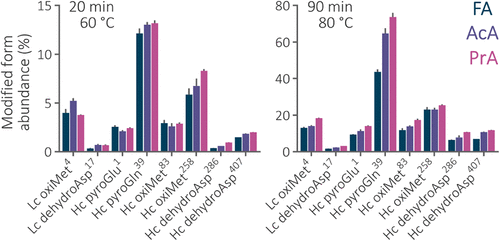
Figure 3. Relative abundance of the modified peptide forms in the 20 and 90 min separations of bevacizumab peptides using the 2.1 × 150 mm Acquity Premier CSH C18 column maintained at 60 and 80 °C. The abundance was calculated as the peak area of all the precursors of the modified peptide divided by the summed area of both peptide forms. The most abundant modified peptide containing the modified amino acid was used. Abbreviations: Lc – light chain, Hc – heavy chain. The superscripted numbers correspond to the position of the modified amino acid in the chain sequence.
Figure 4

Figure 4. (A) Relative increase in the number of identified peptides from various sample inputs of digested Jurkat cell proteins separated within a 60 min gradient using the 1.0 × 150 mm Acquity UPLC CSH C18 column maintained at 60 °C and mobile phases containing AcA and PrA in comparison to FA. An average number of peptides identified under the FA conditions is highlighted above. (B) Relative increase in identifications in analyses using different columns. Data set descriptions include stationary phase ligand, internal column diameter, and sample load. A plus sign indicates a positively charged surface of the stationary phase. (C) Ratios of peptide identifications in the experiment involving the trap-elute configuration. Abbreviations: ret – fraction of peptides retained in the trap column during a 2 min isocratic loading step and analyzed in the subsequent blank injection, nonret – fraction of peptides that eluted from the trap column during the loading step, and ctrl – number of identifications using direct injection of peptides into the separation column through a bypass capillary. (D) Relative change of tR and w0.5 of 400 peptides from digested Jurkat cell proteins analyzed on different columns using mobile phases containing AcA and PrA relative to FA. The mean and standard deviation are illustrated. Peptides were randomly selected from each column data set separately. The spectra were manually revised to ensure correct peak selection and integration. The numbers above correspond to average w0.5 (s) in the FA data sets.
Figure 5

Figure 5. Relative change in the number of identified peptides in nanoflow analyses of various sample inputs separated using a mobile phase containing AcA or PrA in comparison to FA. An average number of peptides identified under the FA conditions is highlighted above. Results from three research facilities exploiting Orbitrap Exploris 480 (BRC), timsTOF Ultra 2 (OPTIn), and timsTOF SCP (IMB) mass spectrometers are illustrated.
References
This article references 67 other publications.
- 1Zhang, Z.; Wu, S.; Stenoien, D. L.; Pasa-Tolic, L. High-throughput proteomics. Annu. Rev. Anal Chem 2014, 7, 427– 454, DOI: 10.1146/annurev-anchem-071213-020216There is no corresponding record for this reference.
- 2Aebersold, R.; Mann, M. Mass-spectrometric exploration of proteome structure and function. Nature 2016, 537, 347– 355, DOI: 10.1038/nature19949There is no corresponding record for this reference.
- 3Ishihama, Y. Proteomic LC-MS systems using nanoscale liquid chromatography with tandem mass spectrometry. J. Chromatogr. A 2005, 1067, 73– 83, DOI: 10.1016/j.chroma.2004.10.107There is no corresponding record for this reference.
- 4McCalley, D. V. Effect of buffer on peak shape of peptides in reversed-phase high performance liquid chromatography. J. Chromatogr. A 2004, 1038, 77– 84, DOI: 10.1016/j.chroma.2004.03.038There is no corresponding record for this reference.
- 5Issaq, H. J.; Fox, S. D.; Mahadevan, M.; Conrads, T. P.; Veenstra, T. D. Effect of experimental parameters on the HPLC separation of peptides and proteins. J. Liq. Chromatogr. Relat. Technol. 2003, 26, 2255– 2283, DOI: 10.1081/JLC-120023246There is no corresponding record for this reference.
- 6Guo, D. C.; Mant, C. T.; Hodges, R. S. Effects of ion-pairing reagents on the prediction of peptide retention in reversed-phase high-performance liquid chromatography. J. Chromatogr. A 1987, 386, 205– 222, DOI: 10.1016/S0021-9673(01)94598-4There is no corresponding record for this reference.
- 7Khalikova, M. A.; Skarbalius, L.; Naplekov, D. K.; Jadeja, S.; Svec, F.; Lenco, J. Evaluation of strategies for overcoming trifluoroacetic acid ionization suppression resulted in single-column intact level, middle-up, and bottom-up reversed-phase LC-MS analyses of antibody biopharmaceuticals. Talanta 2021, 233, 122512, DOI: 10.1016/j.talanta.2021.122512There is no corresponding record for this reference.
- 8Garcia, M. C. The effect of the mobile phase additives on sensitivity in the analysis of peptides and proteins by high-performance liquid chromatography-electrospray mass spectrometry. J. Chromatogr. B 2005, 825, 111– 123, DOI: 10.1016/j.jchromb.2005.03.041There is no corresponding record for this reference.
- 9Apffel, A.; Fischer, S.; Goldberg, G.; Goodley, P. C.; Kuhlmann, F. E. Enhanced sensitivity for peptide mapping with electrospray liquid chromatography-mass spectrometry in the presence of signal suppression due to trifluoroacetic acid-containing mobile phases. J. Chromatogr. A 1995, 712, 177– 190, DOI: 10.1016/0021-9673(95)00175-MThere is no corresponding record for this reference.
- 10Kuhlmann, F. E.; Apffel, A.; Fischer, S. M.; Goldberg, G.; Goodley, P. C. Signal enhancement for gradient reverse-phase high-performance liquid chromatography-electrospray ionization mass spectrometry analysis with trifluoroacetic and other strong acid modifiers by postcolumn addition of propionic acid and isopropanol. J. Am. Soc. Mass Spectrom 1995, 6, 1221– 1225, DOI: 10.1016/1044-0305(95)00571-4There is no corresponding record for this reference.
- 11Lauber, M. A.; Koza, S. M.; McCall, S. A.; Alden, B. A.; Iraneta, P. C.; Fountain, K. J. High-resolution peptide mapping separations with MS-friendly mobile phases and charge-surface-modified C18. Anal. Chem 2013, 85, 6936– 6944, DOI: 10.1021/ac401481zThere is no corresponding record for this reference.
- 12Kadlecova, Z.; Kozlik, P.; Tesarova, E.; Gilar, M.; Kalikova, K. Characterization and comparison of mixed-mode and reversed-phase columns; interaction abilities and applicability for peptide separation. J. Chromatogr. A 2021, 1648, 462182, DOI: 10.1016/j.chroma.2021.462182There is no corresponding record for this reference.
- 13Jadeja, S.; Kupcik, R.; Fabrik, I.; Sklenarova, H.; Lenco, J. A stationary phase with a positively charged surface allows for minimizing formic acid concentration in the mobile phase, enhancing electrospray ionization in LC-MS proteomic experiments. Analyst 2023, 148, 5980– 5990, DOI: 10.1039/D3AN01508DThere is no corresponding record for this reference.
- 14Jadeja, S.; Karsakov, A. A.; Sklenarova, H.; Lenco, J. Evaluating C(18) stationary phases with a positively charged surface for proteomic LC-MS applications using mobile phase acidified with reduced formic acid concentration. J. Chromatogr. A 2024, 1730, 465142, DOI: 10.1016/j.chroma.2024.465142There is no corresponding record for this reference.
- 15Battellino, T.; Ogata, K.; Spicer, V.; Ishihama, Y.; Krokhin, O. Acetic Acid Ion Pairing Additive for Reversed-Phase HPLC Improves Detection Sensitivity in Bottom-up Proteomics Compared to Formic Acid. J. Proteome Res 2023, 22, 272– 278, DOI: 10.1021/acs.jproteome.2c00388There is no corresponding record for this reference.
- 16Lenco, J.; Vajrychova, M.; Pimkova, K.; Proksova, M.; Benkova, M.; Klimentova, J.; Tambor, V.; Soukup, O. Conventional-Flow Liquid Chromatography-Mass Spectrometry for Exploratory Bottom-Up Proteomic Analyses. Anal. Chem 2018, 90, 5381– 5389, DOI: 10.1021/acs.analchem.8b00525There is no corresponding record for this reference.
- 17Huber, C. G.; Premstaller, A. Evaluation of volatile eluents and electrolytes for high-performance liquid chromatography-electrospray ionization mass spectrometry and capillary electrophoresis-electrospray ionization mass spectrometry of proteins. I. Liquid chromatography. J. Chromatogr. A 1999, 849, 161– 173, DOI: 10.1016/S0021-9673(99)00532-4There is no corresponding record for this reference.
- 18Garcia, M. C.; Hogenboom, A. C.; Zappey, H.; Irth, H. Effect of the mobile phase composition on the separation and detection of intact proteins by reversed-phase liquid chromatography-electrospray mass spectrometry. J. Chromatogr. A 2002, 957, 187– 199, DOI: 10.1016/S0021-9673(02)00345-XThere is no corresponding record for this reference.
- 19Wang, S.; Xing, T.; Liu, A. P.; He, Z.; Yan, Y.; Daly, T. J.; Li, N. Simple Approach for Improved LC-MS Analysis of Protein Biopharmaceuticals via Modification of Desolvation Gas. Anal. Chem 2019, 91, 3156– 3162, DOI: 10.1021/acs.analchem.8b05846There is no corresponding record for this reference.
- 20Li, Z.; Li, L. Chemical-vapor-assisted electrospray ionization for increasing analyte signals in electrospray ionization mass spectrometry. Anal. Chem 2014, 86, 331– 335, DOI: 10.1021/ac4036263There is no corresponding record for this reference.
- 21Starovoit, M. R.; Jadeja, S.; Gazarkova, T.; Lenco, J. Mitigating In-Column Artificial Modifications in High-Temperature LC-MS for Bottom-Up Proteomics and Quality Control of Protein Biopharmaceuticals. Anal. Chem 2024, 96, 14531– 14540, DOI: 10.1021/acs.analchem.4c02819There is no corresponding record for this reference.
- 22Pedroso, E.; Grandas, A.; Amor, J. C.; Giralt, E. Reversed-phase high-performance liquid chromatography of protected peptide segments. J. Chromatogr 1987, 409, 281– 290, DOI: 10.1016/S0021-9673(01)86804-7There is no corresponding record for this reference.
- 23Shou, W. Z.; Naidong, W. Simple means to alleviate sensitivity loss by trifluoroacetic acid (TFA) mobile phases in the hydrophilic interaction chromatography-electrospray tandem mass spectrometric (HILIC-ESI/MS/MS) bioanalysis of basic compounds. J. Chromatogr. B 2005, 825, 186– 192, DOI: 10.1016/j.jchromb.2005.01.011There is no corresponding record for this reference.
- 24Bjorneholm, O.; Ohrwall, G.; de Brito, A. N.; Agren, H.; Carravetta, V. Superficial Tale of Two Functional Groups: On the Surface Propensity of Aqueous Carboxylic Acids, Alkyl Amines, and Amino Acids. Acc. Chem. Res 2022, 55, 3285– 3293, DOI: 10.1021/acs.accounts.2c00494There is no corresponding record for this reference.
- 25Eberhard, C. D.; Braswell, C.; Orsburn, B. C. Alternative Ion-Pairing Modifiers Should Be Investigated in Low-Input and Single-Cell Proteomics. J. Proteome Res. 2025, 24 (12), 6338– 6343, DOI: 10.1021/acs.jproteome.5c00930There is no corresponding record for this reference.
- 26Deutsch, E. W. The ProteomeXchange consortium at 10 years: 2023 update. Nucleic Acids Res 2023, 51, D1539– D1548, DOI: 10.1093/nar/gkac1040There is no corresponding record for this reference.
- 27MacLean, B.; Tomazela, D. M.; Shulman, N.; Chambers, M.; Finney, G. L.; Frewen, B.; Kern, R.; Tabb, D. L.; Liebler, D. C.; MacCoss, M. J. Skyline: an open source document editor for creating and analyzing targeted proteomics experiments. Bioinformatics 2010, 26, 966– 968, DOI: 10.1093/bioinformatics/btq054There is no corresponding record for this reference.
- 28Kozlowski, L. P. IPC 2.0: prediction of isoelectric point and pKa dissociation constants. Nucleic Acids Res 2021, 49, W285– W292, DOI: 10.1093/nar/gkab295There is no corresponding record for this reference.
- 29Lenco, J.; Semlej, T.; Khalikova, M. A.; Fabrik, I.; Svec, F. Sense and Nonsense of Elevated Column Temperature in Proteomic Bottom-up LC-MS Analyses. J. Proteome Res 2021, 20, 420– 432, DOI: 10.1021/acs.jproteome.0c00479There is no corresponding record for this reference.
- 30Jadeja, S.; Naplekov, D. K.; Starovoit, M. R.; Plachka, K.; Ritchie, H.; Lawhorn, J.; Sklenarova, H.; Lenco, J. Microflow LC-MS Bottom-Up Proteomics Using 1.5 mm Internal Diameter Columns. ACS Omega 2025, 10, 4094– 4101, DOI: 10.1021/acsomega.4c10591There is no corresponding record for this reference.
- 31Bian, Y.; Zheng, R.; Bayer, F. P.; Wong, C.; Chang, Y.-C.; Meng, C.; Zolg, D. P.; Reinecke, M.; Zecha, J.; Wiechmann, S. Robust, reproducible and quantitative analysis of thousands of proteomes by micro-flow LC–MS/MS. Nat. Commun 2020, 11, 157, DOI: 10.1038/s41467-019-13973-xThere is no corresponding record for this reference.
- 32Varra, M. O.; Husakova, L.; Patocka, J.; Ghidini, S.; Zanardi, E. Multi-element signature of cuttlefish and its potential for the discrimination of different geographical provenances and traceability. Food Chem 2021, 356, 129687, DOI: 10.1016/j.foodchem.2021.129687There is no corresponding record for this reference.
- 33US EPA. Method 8270D: semivolatile Organic Compounds by Gas Chromatography/Mass Spectrometry. US EPA 2007.There is no corresponding record for this reference.
- 34Thermo Scientific. Acclaim Organic Acid (OA) columns: for separation of hydrophilic aliphatic and aromatic organic acids. Thermo Scientific 2020.There is no corresponding record for this reference.
- 35Smith, K. L.; Alexander, M. S.; Stark, J. P. W. The role of molar conductivity in electrospray cone-jet mode current scaling. J. Appl. Phys 2006, 100, 014905, DOI: 10.1063/1.2210169There is no corresponding record for this reference.
- 36Beaudry, F.; Vachon, P. Electrospray ionization suppression, a physical or a chemical phenomenon?. Biomed. Chromatogr 2006, 20, 200– 205, DOI: 10.1002/bmc.553There is no corresponding record for this reference.
- 37Taylor, G. I. Disintegration of water drops in an electric field. Proc. R. Soc. Lond. A. Math. Phys. Sci. 1964, 280, 383– 397, DOI: 10.1098/rspa.1964.0151There is no corresponding record for this reference.
- 38Ganancalvo, A. M.; Lasheras, J. C.; Davila, J.; Barrero, A. The Electrostatic Spray Emitted from an Electrified Conical Meniscus. J. Aerosol Sci 1994, 25, 1121– 1142, DOI: 10.1016/0021-8502(94)90205-4There is no corresponding record for this reference.
- 39de la Mora, J. F. The fluid dynamics of Taylor cones. Annu. Rev. Fluid. Mech 2007, 39, 217– 243, DOI: 10.1146/annurev.fluid.39.050905.110159There is no corresponding record for this reference.
- 40Kebarle, P.; Tang, L. From ions in solution to ions in the gas phase - the mechanism of electrospray mass spectrometry. Anal. Chem 1993, 65, 972A– 986A, DOI: 10.1021/ac00070a001There is no corresponding record for this reference.
- 41Constantopoulos, T. L.; Jackson, G. S.; Enke, C. G. Effects of salt concentration on analyte response using electrospray ionization mass spectrometry. J. Am. Soc. Mass Spectrom 1999, 10, 625– 634, DOI: 10.1016/S1044-0305(99)00031-8There is no corresponding record for this reference.
- 42Enke, C. G. A predictive model for matrix and analyte effects in electrospray ionization of singly-charged ionic analytes. Anal. Chem 1997, 69, 4885– 4893, DOI: 10.1021/ac970095wThere is no corresponding record for this reference.
- 43Rayleigh, L. XX. On the equilibrium of liquid conducting masses charged with electricity. The London, Edinburgh, and Dublin Philosophical Magazine and Journal of Science; Taylor & Francis, 1882; 14, 184– 186 DOI: 10.1080/14786448208628425There is no corresponding record for this reference.
- 44Jasper, J. J.; Wedlick, H. L. Effect of temperature on the surface tension and density of trifluoroacetic acid. J. Chem. Eng. Data 1964, 9, 446– 447, DOI: 10.1021/je60022a049There is no corresponding record for this reference.
- 45Alvarez, E.; Vazquez, G.; SanchezVilas, M.; Sanjurjo, B.; Navaza, J. M. Surface tension of organic acids plus water binary mixtures from 20 degrees C to 50 degrees C. J. Chem. Eng. Data 1997, 42, 957– 960, DOI: 10.1021/je970025mThere is no corresponding record for this reference.
- 46International Labour Organization; World Health Organization. International Chemical Safety Cards (1673, 0485, 0363, 0806); International Labour Organization; World Health Organization, 2017.There is no corresponding record for this reference.
- 47Smith, J. N.; Flagan, R. C.; Beauchamp, J. L. Droplet evaporation and discharge dynamics in electrospray ionization. J. Phys. Chem. A 2002, 106, 9957– 9967, DOI: 10.1021/jp025723eThere is no corresponding record for this reference.
- 48Sterling, H. J.; Daly, M. P.; Feld, G. K.; Thoren, K. L.; Kintzer, A. F.; Krantz, B. A.; Williams, E. R. Effects of supercharging reagents on noncovalent complex structure in electrospray ionization from aqueous solutions. J. Am. Soc. Mass Spectrom 2010, 21, 1762– 1774, DOI: 10.1016/j.jasms.2010.06.012There is no corresponding record for this reference.
- 49Iavarone, A. T.; Williams, E. R. Mechanism of charging and supercharging molecules in electrospray ionization. J. Am. Chem. Soc 2003, 125, 2319– 2327, DOI: 10.1021/ja021202tThere is no corresponding record for this reference.
- 50Escher, C.; Reiter, L.; MacLean, B.; Ossola, R.; Herzog, F.; Chilton, J.; MacCoss, M. J.; Rinner, O. Using iRT, a normalized retention time for more targeted measurement of peptides. Proteomics 2012, 12, 1111– 1121, DOI: 10.1002/pmic.201100463There is no corresponding record for this reference.
- 51Mant, C. T.; Hodges, R. S. Context-dependent effects on the hydrophilicity/hydrophobicity of side-chains during reversed-phase high-performance liquid chromatography: Implications for prediction of peptide retention behaviour. J. Chromatogr. A 2006, 1125, 211– 219, DOI: 10.1016/j.chroma.2006.05.063There is no corresponding record for this reference.
- 52Lenco, J.; Jadeja, S.; Naplekov, D. K.; Krokhin, O. V.; Khalikova, M. A.; Chocholous, P.; Urban, J.; Broeckhoven, K.; Novakova, L.; Svec, F. Reversed-Phase Liquid Chromatography of Peptides for Bottom-Up Proteomics: A Tutorial. J. Proteome Res 2022, 21, 2846– 2892, DOI: 10.1021/acs.jproteome.2c00407There is no corresponding record for this reference.
- 53Hahne, H.; Pachl, F.; Ruprecht, B.; Maier, S. K.; Klaeger, S.; Helm, D.; Medard, G.; Wilm, M.; Lemeer, S.; Kuster, B. DMSO enhances electrospray response, boosting sensitivity of proteomic experiments. Nat. Methods 2013, 10, 989– 991, DOI: 10.1038/nmeth.2610There is no corresponding record for this reference.
- 54Gussakovsky, D.; Anderson, G.; Spicer, V.; Krokhin, O. V. Peptide separation selectivity in proteomics LC-MS experiments: Comparison of formic and mixed formic/heptafluorobutyric acids ion-pairing modifiers. J. Sep. Sci 2020, 43, 3830– 3839, DOI: 10.1002/jssc.202000578There is no corresponding record for this reference.
- 55Mitulovic, G.; Smoluch, M.; Chervet, J. P.; Steinmacher, I.; Kungl, A.; Mechtler, K. An improved method for tracking and reducing the void volume in nano HPLC-MS with micro trapping columns. Anal. Bioanal. Chem 2003, 376, 946– 951, DOI: 10.1007/s00216-003-2047-2There is no corresponding record for this reference.
- 56Abele, M.; Soleymaniniya, A.; Bayer, F. P.; Lomp, N.; Doll, E.; Meng, C.; Neuhaus, K.; Scherer, S.; Wenning, M.; Wantia, N. Proteomic Diversity in Bacteria: Insights and Implications for Bacterial Identification. Mol. Cell. Proteomics 2025, 24, 100917, DOI: 10.1016/j.mcpro.2025.100917There is no corresponding record for this reference.
- 57Szyrwiel, L.; Gille, C.; Mülleder, M.; Demichev, V.; Ralser, M. Fast proteomics with dia-PASEF and analytical flow-rate chromatography. Proteomics 2024, 24, 2300100, DOI: 10.1002/pmic.202300100There is no corresponding record for this reference.
- 58Wilm, M.; Mann, M. Analytical properties of the nanoelectrospray ion source. Anal. Chem 1996, 68, 1– 8, DOI: 10.1021/ac9509519There is no corresponding record for this reference.
- 59Juraschek, R.; Dülcks, T.; Karas, M. Nanoelectrospray─More than just a minimized-flow electrospray ionization source. J. Am. Soc. Mass. Spectrom. 1999, 10, 300– 308, DOI: 10.1016/S1044-0305(98)00157-3There is no corresponding record for this reference.
- 60Konermann, L.; Ahadi, E.; Rodriguez, A. D.; Vahidi, S. Unraveling the Mechanism of Electrospray Ionization. Anal. Chem 2013, 85, 2– 9, DOI: 10.1021/ac302789cThere is no corresponding record for this reference.
- 61Markert, C.; Thinius, M.; Lehmann, L.; Heintz, C.; Stappert, F.; Wissdorf, W.; Kersten, H.; Benter, T.; Schneider, B. B.; Covey, T. R. Observation of charged droplets from electrospray ionization (ESI) plumes in API mass spectrometers. Anal. Bioanal. Chem 2021, 413, 5587– 5600, DOI: 10.1007/s00216-021-03452-yThere is no corresponding record for this reference.
- 62Xia, Z. J.; Williams, E. R. Effect of droplet lifetime on where ions are formed in electrospray ionization. Analyst 2019, 144, 237– 248, DOI: 10.1039/C8AN01824CThere is no corresponding record for this reference.
- 63Olsen, J. V.; de Godoy, L. M.; Li, G.; Macek, B.; Mortensen, P.; Pesch, R.; Makarov, A.; Lange, O.; Horning, S.; Mann, M. Parts per million mass accuracy on an Orbitrap mass spectrometer via lock mass injection into a C-trap. Mol. Cell. Proteomics 2005, 4, 2010– 2021, DOI: 10.1074/mcp.T500030-MCP200There is no corresponding record for this reference.
- 64Monnin, C.; Ramrup, P.; Daigle-Young, C.; Vuckovic, D. Improving negative liquid chromatography/electrospray ionization mass spectrometry lipidomic analysis of human plasma using acetic acid as a mobile-phase additive. Rapid Commun. Mass Spectrom 2018, 32, 201– 211, DOI: 10.1002/rcm.8024There is no corresponding record for this reference.
- 65Song, W. Y.; Park, H.; Kim, T. Y. Improving liquid chromatography-mass spectrometry sensitivity for characterization of lignin oligomers and phenolic compounds using acetic acid as a mobile phase additive. J. Chromatogr. A 2022, 1685, 463598, DOI: 10.1016/j.chroma.2022.463598There is no corresponding record for this reference.
- 66Engelhardt, H.; Lobert, T. Chromatographic determination of metallic impurities in reversed-phase HPLC columns. Anal. Chem 1999, 71, 1885– 1892, DOI: 10.1021/ac981198xThere is no corresponding record for this reference.
- 67Ijames, C. F.; Dutky, R. C.; Fales, H. M. Iron carboxylate oxygen-centered-triangle complexes detected during electrospray use of organic acid modifiers with a comment on the finnigan TSQ-700 electrospray inlet system. J. Am. Soc. Mass Spectrom 1995, 6, 1226– 1231, DOI: 10.1016/1044-0305(95)00579-XThere is no corresponding record for this reference.
Supporting Information
Supporting Information
The Supporting Information is available free of charge at https://pubs.acs.org/doi/10.1021/acs.analchem.5c07595.
Sample preparation (Note S1); search parameters for bottom-up LC-MS data (Note S2); GC-MS profiling (Note S3); ion source settings (Table S1); settings of MS1 and DDA/DIA experiments (Table S2); concentration (ppb) of elements influenced by the selection of acidifier (Table S3); effects of alternative additives on peak width, charge distribution, and base peak intensity of model peptides (Figure S1); abundance of precursor charge states in peptide mapping of monoclonal antibody (Figure S2); peptide hydrophobicity- and pI-dependent change of AUC (Figure S3); effects of adding DMSO to PrA-containing mobile phase on total ion current and charge distribution in microflow analyses (Figure S4); peptide hydrophobicity-dependent change of retention time (Figure S5); dependence of retention behavior on peptide pI (Figure S6); dependence of peak broadening on peptide hydrophobicity in separation using HALO column (Figure S7); effects of alternative additives on peptide modification rate in the analysis of complex sample (Figure S8); relative concentrations of elements in treated mobile phase samples (Figure S9); effect of alternative additives on MS background noise (Figure S10) (PDF)
Terms & Conditions
Most electronic Supporting Information files are available without a subscription to ACS Web Editions. Such files may be downloaded by article for research use (if there is a public use license linked to the relevant article, that license may permit other uses). Permission may be obtained from ACS for other uses through requests via the RightsLink permission system: http://pubs.acs.org/page/copyright/permissions.html.