


This publication is free to access through this site. Learn More

ACS Editors' Choice® is a collection designed to feature scientific articles of broad public interest. Read the latest articles
Gas–Liquid Mass Transfer in Unbaffled Multi-Impeller Stirred Tank Reactors for Vinylidene Fluoride Emulsion Polymerization under Supercritical Conditions: Experimental Pressure-Based Approach and CFD Simulations of HydrodynamicsClick to copy article linkArticle link copied!
- Micheli Nolasco AraujoMicheli Nolasco AraujoUniversite Claude Bernard Lyon 1, CP2M UMR 5128, CNRS, 69616 Villeurbanne, FranceMore by Micheli Nolasco Araujo
- Thomas BoucherèsThomas BoucherèsArkema, Centre de Recherche Rhône-Alpes Rue Henri-Moissan, 69149 Oullins-Pierre-Bénite, FranceMore by Thomas Boucherès
- Nida Sheibat-OthmanNida Sheibat-OthmanUniversite Claude Bernard Lyon 1, CNRS, LAGEPP UMR 5007, 69616 Villeurbanne, FranceMore by Nida Sheibat-Othman
- Timothy F. L. McKenna*Timothy F. L. McKenna*Email: [email protected]Universite Claude Bernard Lyon 1, CP2M UMR 5128, CNRS, 69616 Villeurbanne, FranceMore by Timothy F. L. McKenna
Abstract
A nonisothermal method to measure gas–liquid volumetric mass transfer coefficients (kLa) as well as the gas solubility (in water and polymer particles) has been developed to investigate the effects of monomer pressure (ranging from gas to supercritical conditions), agitation rate (and agitator form), and volume of reactor contents on this important quantity. The method was applied to two different autoclaves with different agitation systems and used to study mass transfer in polyvinylidene fluoride (PVDF) latexes. Computational fluid dynamic (CFD) simulations of the two reactors were performed to estimate the vortex surface area and the turbulent energy dissipation rate. For the two reactors considered, estimates of kLa are demonstrated to be strongly correlated with these two quantities. This suggests that, first, gas–liquid (G/L) mass transfer is in large part governed by the headspace–liquid interfacial area and that a more pronounced vortex enhances mass transfer. Then, the incorporated bubbles are broken into smaller bubbles at a rate that is determined by the turbulent energy dissipation rate. Enhancing bubble breakage increases their specific area and leads to faster dissolution of the gaseous monomer. It is shown that this simplified CFD approach, providing these key factors, can be used to predict global mass transfer rates for this polymerization system when the reactor volume and agitation systems vary.
This publication is licensed for personal use by The American Chemical Society.
Special Issue
Published as part of Industrial & Engineering Chemistry Research special issue “Celebrating the Legacy of Prof. Jose M. Asua: Emulsion Polymerization and Polymer Reaction Engineering”.
1. Introduction
1.1. Mass Transfer in G/L Systems
1.2. Volumetric Mass Transfer Coefficient
1.3. Correlations of kLa
2. Material and Methods
2.1. Experimental Setup
Figure 1
Figure 1. Scheme of the R4L reactor and mixing Setup2.
Figure 2
Figure 2. Scheme of R5L reactor and mixing Setup MN1.
2.2. Dynamic Monomer Absorption Experiments
2.3. CFD Simulations
3. New Pressure-Drop Approach to Estimate kLa and Monomer Solubility
Figure 3
Figure 3. Normalized pressure during VDF absorption in a latex of 10% SC at 30 bar for (a) R4L at 83 °C, 400 rpm; (b) R4L at 83 °C, 550 rpm; (c) R5L at 74 °C, 400 rpm; and (d) R5L at 74 °C, 500 rpm.
Figure 4
Figure 4. Temperature during VDF absorption in a latex of 10% SC at 30 bar for (a) R4L at 83 °C, 400 rpm; (b) R4L at 83 °C, 550 rpm; (c) R5L at 74 °C, 400 rpm; and (d) R5L at 74 °C, 500 rpm.
| monomer mass balance |  (4) |
| concentration of monomer in polymer (mol m–3) |  (5) |
| concentration of monomer in amorphous polymer (mol m–3 am pol) |  (6) |
| monomer partitioning coefficient (−) (9) |  (7) |
| number of moles of monomer in amorphous polymer (mol) |  (8) |
| number of moles of monomer in water (mol) |  (9) |
| number of moles of monomer in the gas phase (m3) |  (10) |
| volume of swollen particles (m3) |  (11) |
| volume of monomer in water (m3) |  (12) |
| volume of the latex (m3) |  (13) |
| volume of gas (m3) |  (14) |
| reduced pressure (−) |  (15) |
| compressibility factor for VDF (−) |  (16) |
| pressure (Pa) |  (17) |
4. Results and Discussion
4.1. Estimation of Monomer Solubility in Water and Polymer Particles by Model Fitting to Experimental Pressure
Figure 5
Figure 5. Solubility of VDF in water at 74 and 83 °C estimated by model fitting to the measured pressure. Experimental conditions for R4L reactor: 400 rpm, 2.2 L of water (30 and 60 bar) and 2.5 L (90 bar). Experimental conditions for R5L reactor: 500 rpm, 2.6 L of water (30, 50, and 90 bar).
Figure 6
Figure 6. Solubility of VDF in amorphous polymers estimated by model fitting to the measured pressure. Experimental conditions: R4L reactor, 83 °C, 550 rpm, and 2.5 L latex at 10% SC.
| concentration of monomer in water at saturation (mol m–3) | T (°C) | P (bar) | |
|---|---|---|---|
| R4L | [M]wsat = 0.7299 P | 83 | 0–90 |
| R5L | [M]wsat = 0.7462 P | 74 | 0–90 |
| concentration of monomer in amorphous polymer at saturation (mol m–3 am. p.) | T (°C) | P (bar) | |
|---|---|---|---|
| R4L | [M]p,amsat = 20.762 P | 83 | 0–90 |
4.2. Estimation of the Volumetric Mass Transfer Coefficient kLa by Model Fitting to Experimental Dynamic Pressure and Estimation of the Energy Dissipation and the Vortex Area by CFD
Figure 7
Figure 7. Experimental volumetric mass transfer coefficient (kLa) as a function of the latex volume at 30 bar and 10% SC (a) R4L reactor at 83 °C and (b) R5L reactor at 74 °C (vertical dashed lines = midpoint of the impeller blades).
Figure 8
Figure 8. Estimation of the vortex area av (by CFD) as a function of volume of water for (a) R4L reactor and (b) R5L reactor (vertical dashed lines = midpoint of the impeller blades).
Figure 9
Figure 9. Average turbulent energy dissipation rate obtained by CFD for (a) reactor R4L and (b) reactor R5L (vertical dashed lines = midpoint of the impeller blades).
Figure 10
Figure 10. Volumetric mass transfer coefficient at 83 °C estimated by model fitting of the pressure absorption. Experimental condition for R4L reactor, Setup2, 550 rpm, and 2.5 L latex.
Figure 11
Figure 11. Vortex (a) area and (b) shape obtained by CFD at R4L reactor, Setup2, and 2.2 L of water for different pressure.
4.3. New Correlations for kLa
Figure 12
Figure 12. (a) Volumetric mass transfer coefficient (kLa) (experimental and by eq 20) and (b) correlation versus experimental values of kLa at 83 °C, 30 bar, and 10% SC for the R4L reactor (vertical dashed lines = midpoint of the impeller blades).
Figure 13
Figure 13. (a) Volumetric mass transfer coefficient (kLa) (experimental and by eq 20) and (b) correlation versus experimental values of kLa at 74 °C, 30 bar, and 10% SC for the R5L reactor (vertical dashed lines = midpoint of the impeller blades).
| parameter | R4L 83 °C | R5L 74 °C |
|---|---|---|
| A | 0.7396 | 0.2476 |
| B | 1.1970 | 1.5014 |
| C | 0.9652 | 0.6058 |
5. Conclusions
The pressure has a positive effect on the solubility of VDF in water.
kLa increases with pressure, since the difference between density of gas and liquid decreases, so the area of vortex increases.
Increasing the rate of agitation enhances mass transfer since it increases both the energy dissipation (so bubble breakup) and the vortex.
When volume of latex (i.e., position of the headspace–liquid interface with respect to the impeller) is close to the middle of impeller, kLa increases, due to the increased vortex. However, the energy dissipation generally decreases with the volume.
Author Information
- Timothy F. L. McKenna - Universite Claude Bernard Lyon 1, CP2M UMR 5128, CNRS, 69616 Villeurbanne, France;
 https://orcid.org/0000-0001-6437-5942;
- Nida Sheibat-Othman - Universite Claude Bernard Lyon 1, CNRS, LAGEPP UMR 5007, 69616 Villeurbanne, France;https://orcid.org/0000-0002-2822-9566
| a | mass transfer area (m2) |
| av | vortex area (m2) |
| d | bubble diameter (m) |
| Di | diameter of impeller (m) |
| Dr | diameter of reactor (m) |
| kL | mass transfer coefficient (s–1 m–2) |
| Kwp | monomer partitioning coefficient (−) |
| [M]w | concentration of monomer in the water (mol m–3) |
| [M]wsat | concentration of monomer in the water at saturation (mol m–3) |
| [M]p | concentration of monomer in the polymer (mol m–3) |
| [M]p,am | concentration of monomer in amorphous polymer (mol m–3) |
| [M]psat | concentration of monomer in the polymer at saturation (mol m–3) |
| Mw,m | molecular weight (kg mol–1) |
| ng | number of moles of monomer in reactor headspace (mol) |
| np | number of moles of monomer in polymer (mol) |
| nw | number of moles of monomer in water (mol) |
| N | agitation rate (rps) |
| Ni | number of immersed impellers |
| P | gas pressure (Pa) |
| Pc | critical pressure (Pa) |
| Pr | reduced pressure (−) |
| Qw | exit flow rate of liquid phase (mol s–1) |
| R | ideal gas constant (J mol–1 K–1) |
| Rp | rate of polymerization (mol m–3 s–1) |
| t | time (s) |
| T | reactor temperature (K) |
| VG | volume of gas (m3) |
| VL | volume of liquid (m3) |
| Vmp | volume of monomer in polymer (m3) |
| Vmw | volume of monomer in water (m3) |
| Vp | volume of polymer (m3) |
| Vpart | volume of swollen particle (m3) |
| Vw | volume of water (m3) |
| Z | compressibility factor |
| ε | energy dissipation (W kg–1) |
| ρ | density (kg m–3) |
| σ | interfacial tension (N m–1) |
| χ | crystallinity (%) |
| Ω | bubble breakage frequency |
References
This article references 31 other publications.
- 1Petříček, R.; Labík, L.; Moucha, T.; Brucato, A.; Scargiali, F. Gas-Liquid Mass Transfer Rates in Unbaffled Tanks Stirred by PBT: Scale-up Effects and Pumping Direction. Chem. Eng. Res. Des. 2018, 137, 265– 272, DOI: 10.1016/j.cherd.2018.07.006Google ScholarThere is no corresponding record for this reference.
- 2Scott, P. J.; Penlidis, A.; Rempel, G. L. Reactor Emulsion Design Considerations Polymerizations : The Acetate for Gas-Liquid. 1994; Vol. 49 10.Google ScholarThere is no corresponding record for this reference.
- 3Ranganathan, P.; Sivaraman, S. Investigations on Hydrodynamics and Mass Transfer in Gas-Liquid Stirred Reactor Using Computational Fluid Dynamics. Chem. Eng. Sci. 2011, 66 (14), 3108– 3124, DOI: 10.1016/j.ces.2011.03.007Google ScholarThere is no corresponding record for this reference.
- 4Moucha, T.; Linek, V.; Prokopová, E. Gas Hold-up, Mixing Time and Gas-Liquid Volumetric Mass Transfer Coefficient of Various Multiple-Impeller Configurations: Rushton Turbine, Pitched Blade and Techmix Impeller and Their Combinations. Chem. Eng. Sci. 2003, 58 (9), 1839– 1846, DOI: 10.1016/S0009-2509(02)00682-6Google ScholarThere is no corresponding record for this reference.
- 5Žák, Ž. A.; Zedníková, M.; Moucha, T. Local Volumetric Mass Transfer Coefficients in Sections of Multiple-Impeller Stirred Tank Reactors: Data Analysis. Chem. Eng. Res. Des. 2023, 190, 829– 841, DOI: 10.1016/j.cherd.2023.01.001Google ScholarThere is no corresponding record for this reference.
- 6Prakash, B.; Bhatelia, T.; Wadnerkar, D.; Shah, M. T.; Pareek, V. K.; Utikar, R. P. Vortex Shape and Gas-Liquid Hydrodynamics in Unbaffled Stirred Tank. Can. J. Chem. Eng. 2019, 97 (6), 1913– 1920, DOI: 10.1002/cjce.23433Google ScholarThere is no corresponding record for this reference.
- 7Busciglio, A.; Caputo, G.; Scargiali, F. Free-Surface Shape in Unbaffled Stirred Vessels: Experimental Study via Digital Image Analysis. Chem. Eng. Sci. 2013, 104, 868– 880, DOI: 10.1016/j.ces.2013.10.019Google ScholarThere is no corresponding record for this reference.
- 8Aladro, M. G. T.; Gelinski, E. K.; Sheibat-Othman, N.; McKenna, T. F. L. Mass Transfer in Emulsion Polymerization: High Solids Content Latex and Mixing Effects. Macromol. React. Eng. 2025, 19, 2300064 DOI: 10.1002/mren.202300064Google ScholarThere is no corresponding record for this reference.
- 9Gelinski, E. K.; Sheibat-Othman, N.; McKenna, T. F. L. Mass Transfer in Emulsion Polymerization: An Experimental and Modelling Study. Can. J. Chem. Eng. 2024, 102 (2), 532– 547, DOI: 10.1002/cjce.25120Google ScholarThere is no corresponding record for this reference.
- 10Ecoscia, A. C. M.; Sheibat-Othman, N.; McKenna, T. F. L. Emulsion Polymerization of Vinylidene Fluoride: Effects of Mixing and Reaction Conditions on the Initial Rate of Polymerization. Can. J. Chem. Eng. 2022, 100 (4), 654– 665, DOI: 10.1002/cjce.24145Google ScholarThere is no corresponding record for this reference.
- 11Merlin, J.; Schork, F. J. Monomer Transport in Emulsion Polymerization IV Gaseous Monomers. Macromol. React. Eng. 2024, 18 (1), 2023– 2025, DOI: 10.1002/mren.202300048Google ScholarThere is no corresponding record for this reference.
- 12Schork, F. J. Monomer Transport in Emulsion Polymerization. Can. J. Chem. Eng. 2022, 100 (4), 645– 653, DOI: 10.1002/cjce.24075Google ScholarThere is no corresponding record for this reference.
- 13Paul, E. L.; Atiemo-Obeng, V. A.; Kresta, S. M. Handbook of Industrial Mixing: Science and Practice; John Wiley and Sons Inc, 2003.Google ScholarThere is no corresponding record for this reference.
- 14Van’t Riet, K. Review of Measuring Methods and Results in Nonviscous Gas-Liquid Mass Transfer in Stirred Vessels. Ind. Eng. Chem. Proc. Des. Dev. 1979, 18 (3), 357– 364, DOI: 10.1021/i260071a001Google ScholarThere is no corresponding record for this reference.
- 15Scargiali, F.; Busciglio, A.; Grisafi, F.; Brucato, A. Mass Transfer and Hydrodynamic Characteristics of Unbaffled Stirred Bio-Reactors: Influence of Impeller Design. Biochem. Eng. J. 2014, 82, 41– 47, DOI: 10.1016/j.bej.2013.11.009Google ScholarThere is no corresponding record for this reference.
- 16Chaudhari, R. V.; Gholap, R. V.; Emig, G.; Hofmann, H. Gas-liquid Mass Transfer in “Dead-end” Autoclave Reactors. Can. J. Chem. Eng. 1987, 65 (5), 744– 751, DOI: 10.1002/cjce.5450650506Google ScholarThere is no corresponding record for this reference.
- 17Busciglio, A.; Grisafi, F.; Scargiali, F.; Brucato, A. On the Measurement of Local Gas Hold-up and Interfacial Area in Gas-Liquid Contactors via Light Sheet and Image Analysis. Chem. Eng. Sci. 2010, 65 (12), 3699– 3708, DOI: 10.1016/j.ces.2010.03.004Google ScholarThere is no corresponding record for this reference.
- 18Dietrich, E.; Mathieu, C.; Delmas, H.; Jenck, J. Raney-Nickel Catalyzed Hydrogenations: Gas-Liquid Mass Transfer in Gas-Induced Stirred Slurry Reactors. Chem. Eng. Sci. 1992, 47 (13–14), 3597– 3604, DOI: 10.1016/0009-2509(92)85075-MGoogle ScholarThere is no corresponding record for this reference.
- 19Chaudhry, M. A. Lessons in Bioreactor Scale-Up, Part 5: Theoretical and Empirical Correlations for Predicting the Mass-Transfer Coefficient in Stirred-Tank Bioreactors. https://www.bioprocessintl.com/bioreactors/lessons-in-bioreactor-scale-up-part-5-theoretical-and-empirical-correlations-for-predicting-the-mass-transfer-coefficient-in-stirred-tank-bioreactors.Google ScholarThere is no corresponding record for this reference.
- 20Sideman, S.; Hortacsu, O.; Fulton, J. W. Mass Transfer in Gas-Liquid Contacting Systems: A Critical Review with Suggested Generalized Correlations. Ind. Eng. Chem. 1966, 58 (7), 32– 47, DOI: 10.1021/ie50679a006Google ScholarThere is no corresponding record for this reference.
- 21Bakhvalov, P. A.; Kozubskaya, T. K. Construction of Edge-Based 1-Exact Schemes for Solving the Euler Equations on Hybrid Unstructured Meshes. Comput. Math. Math. Phys. 2017, 57, 680– 697, DOI: 10.1134/S0965542517040030Google ScholarThere is no corresponding record for this reference.
- 22Cournède, P.-H.; Koobus, B.; Dervieux, A. Positivity Statements for a Mixed-Element-Volume Scheme on Fixed and Moving Grids. Eur. J. Comput. Mech. 2006, 15 (7–8), 767– 798, DOI: 10.3166/remn.15.767-798Google ScholarThere is no corresponding record for this reference.
- 23Dervieux, A.; Alauzet, F.; Loseille, A.; Koobus, B. Mesh Adaptation for Computational Fluid Dynamics, Vol. 1: Continuous Riemannian Metrics and Feature-Based Adaptation; John Wiley & Sons, Ltd, 2022.Google ScholarThere is no corresponding record for this reference.
- 24Alauzet, F.; Loseille, A. A Decade of Progress on Anisotropic Mesh Adaptation for Computational Fluid Dynamics. Comput. Aided Des. 2016, 72, 13– 39, DOI: 10.1016/j.cad.2015.09.005Google ScholarThere is no corresponding record for this reference.
- 25Sethian, J. A.; Smereka, P. Level Set Methods for Fluid Interfaces. Annu. Rev. Fluid Mech. 2003, 35, 341– 372, DOI: 10.1146/annurev.fluid.35.101101.161105Google ScholarThere is no corresponding record for this reference.
- 26Lesage, A.-C.; Allain, O.; Dervieux, A. On Level Set Modelling of Bi-Fluid Capillary Flow. Int. J. Numer. Methods Fluids 2007, 53, 1297– 1314, DOI: 10.1002/fld.1449Google ScholarThere is no corresponding record for this reference.
- 27Dervieux, A.; Thomasset, F. A Finite Element Method for the Simulation of a Rayleigh-Taylor Instability; Springer: Berlin, Heidelberg: Berlin, 1980; Vol. 771.Google ScholarThere is no corresponding record for this reference.
- 28Smolianski, A. Finite-Element/Level-Set/Operator-Splitting (FELSOS) Approach for Computing Two- Uid Unsteady Ows with Free Moving Interfaces. Int. J. Numer. Methods Fluids 2005, (December 2004), 231– 269, DOI: 10.1002/fld.823Google ScholarThere is no corresponding record for this reference.
- 29Debiez, C.; Dervieux, A. Mixed-Element-Volume MUSCL Methods with Weak Viscosity for Steady and Unsteady Flow Calculations. Comput. Fluids 2000, 29 (1), 89– 118, DOI: 10.1016/S0045-7930(98)00059-0Google ScholarThere is no corresponding record for this reference.
- 30Horiuchi, S.; Uddin, M. A.; Kato, Y.; Takahashi, Y.; Uchida, Y.-I. Mass Transfer between Different Phases in a Mechanically-Stirred Vessel and Its Comparison with That in a Gas-Stirred One. ISIJ Int. 2014, 54 (1), 87– 93, DOI: 10.2355/isijinternational.54.87Google ScholarThere is no corresponding record for this reference.
- 31Coulaloglou, C. A.; Tavlarides, L. L. Description of Interaction Processes in Agitated Liquid-Liquid Dispersions. Chem. Eng. Sci. 1977, 32 (11), 1289– 1297, DOI: 10.1016/0009-2509(77)85023-9Google ScholarThere is no corresponding record for this reference.
Cited By
This article has not yet been cited by other publications.

Article Views
Altmetric
Citations
Article Views are the COUNTER-compliant sum of full text article downloads since November 2008 (both PDF and HTML) across all institutions and individuals. These metrics are regularly updated to reflect usage leading up to the last few days.
Citations are the number of other articles citing this article, calculated by Crossref and updated daily. Find more information about Crossref citation counts.
The Altmetric Attention Score is a quantitative measure of the attention that a research article has received online. Clicking on the donut icon will load a page at altmetric.com with additional details about the score and the social media presence for the given article. Find more information on the Altmetric Attention Score and how the score is calculated.
Recommended Articles
Abstract

Figure 1

Figure 1. Scheme of the R4L reactor and mixing Setup2.
Figure 2

Figure 2. Scheme of R5L reactor and mixing Setup MN1.
Figure 3

Figure 3. Normalized pressure during VDF absorption in a latex of 10% SC at 30 bar for (a) R4L at 83 °C, 400 rpm; (b) R4L at 83 °C, 550 rpm; (c) R5L at 74 °C, 400 rpm; and (d) R5L at 74 °C, 500 rpm.
Figure 4

Figure 4. Temperature during VDF absorption in a latex of 10% SC at 30 bar for (a) R4L at 83 °C, 400 rpm; (b) R4L at 83 °C, 550 rpm; (c) R5L at 74 °C, 400 rpm; and (d) R5L at 74 °C, 500 rpm.
Figure 5
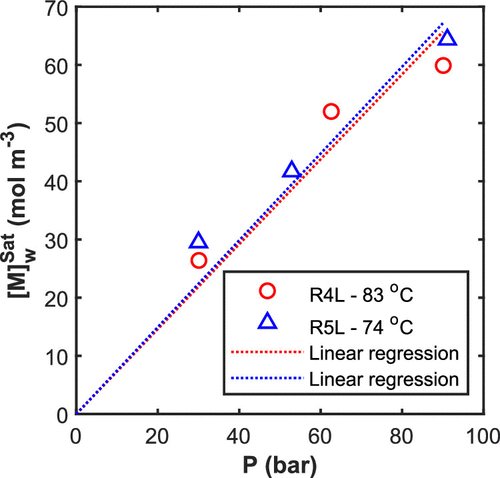
Figure 5. Solubility of VDF in water at 74 and 83 °C estimated by model fitting to the measured pressure. Experimental conditions for R4L reactor: 400 rpm, 2.2 L of water (30 and 60 bar) and 2.5 L (90 bar). Experimental conditions for R5L reactor: 500 rpm, 2.6 L of water (30, 50, and 90 bar).
Figure 6
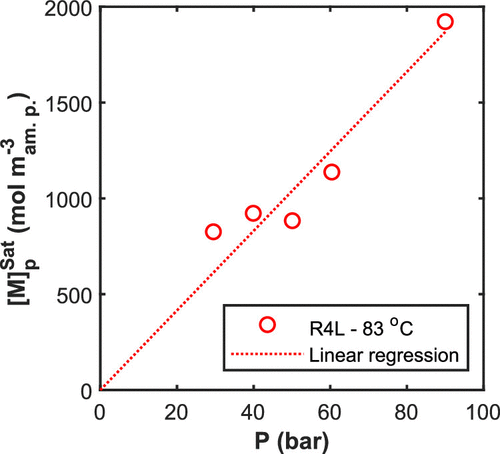
Figure 6. Solubility of VDF in amorphous polymers estimated by model fitting to the measured pressure. Experimental conditions: R4L reactor, 83 °C, 550 rpm, and 2.5 L latex at 10% SC.
Figure 7
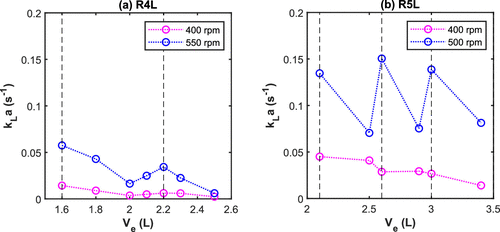
Figure 7. Experimental volumetric mass transfer coefficient (kLa) as a function of the latex volume at 30 bar and 10% SC (a) R4L reactor at 83 °C and (b) R5L reactor at 74 °C (vertical dashed lines = midpoint of the impeller blades).
Figure 8
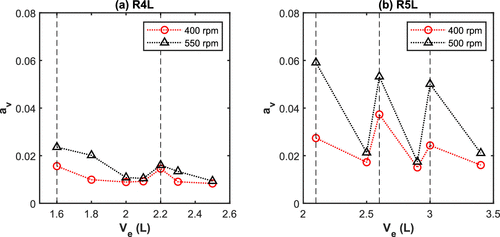
Figure 8. Estimation of the vortex area av (by CFD) as a function of volume of water for (a) R4L reactor and (b) R5L reactor (vertical dashed lines = midpoint of the impeller blades).
Figure 9
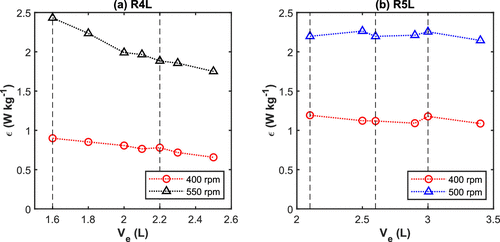
Figure 9. Average turbulent energy dissipation rate obtained by CFD for (a) reactor R4L and (b) reactor R5L (vertical dashed lines = midpoint of the impeller blades).
Figure 10
Figure 10. Volumetric mass transfer coefficient at 83 °C estimated by model fitting of the pressure absorption. Experimental condition for R4L reactor, Setup2, 550 rpm, and 2.5 L latex.
Figure 11
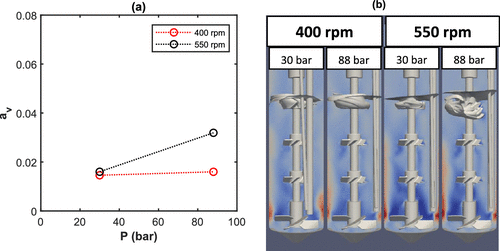
Figure 11. Vortex (a) area and (b) shape obtained by CFD at R4L reactor, Setup2, and 2.2 L of water for different pressure.
Figure 12

Figure 12. (a) Volumetric mass transfer coefficient (kLa) (experimental and by eq 20) and (b) correlation versus experimental values of kLa at 83 °C, 30 bar, and 10% SC for the R4L reactor (vertical dashed lines = midpoint of the impeller blades).
Figure 13
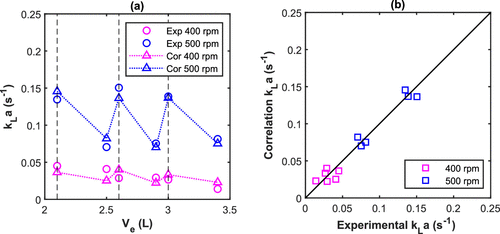
Figure 13. (a) Volumetric mass transfer coefficient (kLa) (experimental and by eq 20) and (b) correlation versus experimental values of kLa at 74 °C, 30 bar, and 10% SC for the R5L reactor (vertical dashed lines = midpoint of the impeller blades).
References
This article references 31 other publications.
- 1Petříček, R.; Labík, L.; Moucha, T.; Brucato, A.; Scargiali, F. Gas-Liquid Mass Transfer Rates in Unbaffled Tanks Stirred by PBT: Scale-up Effects and Pumping Direction. Chem. Eng. Res. Des. 2018, 137, 265– 272, DOI: 10.1016/j.cherd.2018.07.006There is no corresponding record for this reference.
- 2Scott, P. J.; Penlidis, A.; Rempel, G. L. Reactor Emulsion Design Considerations Polymerizations : The Acetate for Gas-Liquid. 1994; Vol. 49 10.There is no corresponding record for this reference.
- 3Ranganathan, P.; Sivaraman, S. Investigations on Hydrodynamics and Mass Transfer in Gas-Liquid Stirred Reactor Using Computational Fluid Dynamics. Chem. Eng. Sci. 2011, 66 (14), 3108– 3124, DOI: 10.1016/j.ces.2011.03.007There is no corresponding record for this reference.
- 4Moucha, T.; Linek, V.; Prokopová, E. Gas Hold-up, Mixing Time and Gas-Liquid Volumetric Mass Transfer Coefficient of Various Multiple-Impeller Configurations: Rushton Turbine, Pitched Blade and Techmix Impeller and Their Combinations. Chem. Eng. Sci. 2003, 58 (9), 1839– 1846, DOI: 10.1016/S0009-2509(02)00682-6There is no corresponding record for this reference.
- 5Žák, Ž. A.; Zedníková, M.; Moucha, T. Local Volumetric Mass Transfer Coefficients in Sections of Multiple-Impeller Stirred Tank Reactors: Data Analysis. Chem. Eng. Res. Des. 2023, 190, 829– 841, DOI: 10.1016/j.cherd.2023.01.001There is no corresponding record for this reference.
- 6Prakash, B.; Bhatelia, T.; Wadnerkar, D.; Shah, M. T.; Pareek, V. K.; Utikar, R. P. Vortex Shape and Gas-Liquid Hydrodynamics in Unbaffled Stirred Tank. Can. J. Chem. Eng. 2019, 97 (6), 1913– 1920, DOI: 10.1002/cjce.23433There is no corresponding record for this reference.
- 7Busciglio, A.; Caputo, G.; Scargiali, F. Free-Surface Shape in Unbaffled Stirred Vessels: Experimental Study via Digital Image Analysis. Chem. Eng. Sci. 2013, 104, 868– 880, DOI: 10.1016/j.ces.2013.10.019There is no corresponding record for this reference.
- 8Aladro, M. G. T.; Gelinski, E. K.; Sheibat-Othman, N.; McKenna, T. F. L. Mass Transfer in Emulsion Polymerization: High Solids Content Latex and Mixing Effects. Macromol. React. Eng. 2025, 19, 2300064 DOI: 10.1002/mren.202300064There is no corresponding record for this reference.
- 9Gelinski, E. K.; Sheibat-Othman, N.; McKenna, T. F. L. Mass Transfer in Emulsion Polymerization: An Experimental and Modelling Study. Can. J. Chem. Eng. 2024, 102 (2), 532– 547, DOI: 10.1002/cjce.25120There is no corresponding record for this reference.
- 10Ecoscia, A. C. M.; Sheibat-Othman, N.; McKenna, T. F. L. Emulsion Polymerization of Vinylidene Fluoride: Effects of Mixing and Reaction Conditions on the Initial Rate of Polymerization. Can. J. Chem. Eng. 2022, 100 (4), 654– 665, DOI: 10.1002/cjce.24145There is no corresponding record for this reference.
- 11Merlin, J.; Schork, F. J. Monomer Transport in Emulsion Polymerization IV Gaseous Monomers. Macromol. React. Eng. 2024, 18 (1), 2023– 2025, DOI: 10.1002/mren.202300048There is no corresponding record for this reference.
- 12Schork, F. J. Monomer Transport in Emulsion Polymerization. Can. J. Chem. Eng. 2022, 100 (4), 645– 653, DOI: 10.1002/cjce.24075There is no corresponding record for this reference.
- 13Paul, E. L.; Atiemo-Obeng, V. A.; Kresta, S. M. Handbook of Industrial Mixing: Science and Practice; John Wiley and Sons Inc, 2003.There is no corresponding record for this reference.
- 14Van’t Riet, K. Review of Measuring Methods and Results in Nonviscous Gas-Liquid Mass Transfer in Stirred Vessels. Ind. Eng. Chem. Proc. Des. Dev. 1979, 18 (3), 357– 364, DOI: 10.1021/i260071a001There is no corresponding record for this reference.
- 15Scargiali, F.; Busciglio, A.; Grisafi, F.; Brucato, A. Mass Transfer and Hydrodynamic Characteristics of Unbaffled Stirred Bio-Reactors: Influence of Impeller Design. Biochem. Eng. J. 2014, 82, 41– 47, DOI: 10.1016/j.bej.2013.11.009There is no corresponding record for this reference.
- 16Chaudhari, R. V.; Gholap, R. V.; Emig, G.; Hofmann, H. Gas-liquid Mass Transfer in “Dead-end” Autoclave Reactors. Can. J. Chem. Eng. 1987, 65 (5), 744– 751, DOI: 10.1002/cjce.5450650506There is no corresponding record for this reference.
- 17Busciglio, A.; Grisafi, F.; Scargiali, F.; Brucato, A. On the Measurement of Local Gas Hold-up and Interfacial Area in Gas-Liquid Contactors via Light Sheet and Image Analysis. Chem. Eng. Sci. 2010, 65 (12), 3699– 3708, DOI: 10.1016/j.ces.2010.03.004There is no corresponding record for this reference.
- 18Dietrich, E.; Mathieu, C.; Delmas, H.; Jenck, J. Raney-Nickel Catalyzed Hydrogenations: Gas-Liquid Mass Transfer in Gas-Induced Stirred Slurry Reactors. Chem. Eng. Sci. 1992, 47 (13–14), 3597– 3604, DOI: 10.1016/0009-2509(92)85075-MThere is no corresponding record for this reference.
- 19Chaudhry, M. A. Lessons in Bioreactor Scale-Up, Part 5: Theoretical and Empirical Correlations for Predicting the Mass-Transfer Coefficient in Stirred-Tank Bioreactors. https://www.bioprocessintl.com/bioreactors/lessons-in-bioreactor-scale-up-part-5-theoretical-and-empirical-correlations-for-predicting-the-mass-transfer-coefficient-in-stirred-tank-bioreactors.There is no corresponding record for this reference.
- 20Sideman, S.; Hortacsu, O.; Fulton, J. W. Mass Transfer in Gas-Liquid Contacting Systems: A Critical Review with Suggested Generalized Correlations. Ind. Eng. Chem. 1966, 58 (7), 32– 47, DOI: 10.1021/ie50679a006There is no corresponding record for this reference.
- 21Bakhvalov, P. A.; Kozubskaya, T. K. Construction of Edge-Based 1-Exact Schemes for Solving the Euler Equations on Hybrid Unstructured Meshes. Comput. Math. Math. Phys. 2017, 57, 680– 697, DOI: 10.1134/S0965542517040030There is no corresponding record for this reference.
- 22Cournède, P.-H.; Koobus, B.; Dervieux, A. Positivity Statements for a Mixed-Element-Volume Scheme on Fixed and Moving Grids. Eur. J. Comput. Mech. 2006, 15 (7–8), 767– 798, DOI: 10.3166/remn.15.767-798There is no corresponding record for this reference.
- 23Dervieux, A.; Alauzet, F.; Loseille, A.; Koobus, B. Mesh Adaptation for Computational Fluid Dynamics, Vol. 1: Continuous Riemannian Metrics and Feature-Based Adaptation; John Wiley & Sons, Ltd, 2022.There is no corresponding record for this reference.
- 24Alauzet, F.; Loseille, A. A Decade of Progress on Anisotropic Mesh Adaptation for Computational Fluid Dynamics. Comput. Aided Des. 2016, 72, 13– 39, DOI: 10.1016/j.cad.2015.09.005There is no corresponding record for this reference.
- 25Sethian, J. A.; Smereka, P. Level Set Methods for Fluid Interfaces. Annu. Rev. Fluid Mech. 2003, 35, 341– 372, DOI: 10.1146/annurev.fluid.35.101101.161105There is no corresponding record for this reference.
- 26Lesage, A.-C.; Allain, O.; Dervieux, A. On Level Set Modelling of Bi-Fluid Capillary Flow. Int. J. Numer. Methods Fluids 2007, 53, 1297– 1314, DOI: 10.1002/fld.1449There is no corresponding record for this reference.
- 27Dervieux, A.; Thomasset, F. A Finite Element Method for the Simulation of a Rayleigh-Taylor Instability; Springer: Berlin, Heidelberg: Berlin, 1980; Vol. 771.There is no corresponding record for this reference.
- 28Smolianski, A. Finite-Element/Level-Set/Operator-Splitting (FELSOS) Approach for Computing Two- Uid Unsteady Ows with Free Moving Interfaces. Int. J. Numer. Methods Fluids 2005, (December 2004), 231– 269, DOI: 10.1002/fld.823There is no corresponding record for this reference.
- 29Debiez, C.; Dervieux, A. Mixed-Element-Volume MUSCL Methods with Weak Viscosity for Steady and Unsteady Flow Calculations. Comput. Fluids 2000, 29 (1), 89– 118, DOI: 10.1016/S0045-7930(98)00059-0There is no corresponding record for this reference.
- 30Horiuchi, S.; Uddin, M. A.; Kato, Y.; Takahashi, Y.; Uchida, Y.-I. Mass Transfer between Different Phases in a Mechanically-Stirred Vessel and Its Comparison with That in a Gas-Stirred One. ISIJ Int. 2014, 54 (1), 87– 93, DOI: 10.2355/isijinternational.54.87There is no corresponding record for this reference.
- 31Coulaloglou, C. A.; Tavlarides, L. L. Description of Interaction Processes in Agitated Liquid-Liquid Dispersions. Chem. Eng. Sci. 1977, 32 (11), 1289– 1297, DOI: 10.1016/0009-2509(77)85023-9There is no corresponding record for this reference.