


This publication is free to access through this site. Learn More

ACS Editors' Choice® is a collection designed to feature scientific articles of broad public interest. Read the latest articles
Thermodynamic Modeling of Mixed Solvent Electrolyte Solutions: Challenges and Practical GuideClick to copy article linkArticle link copied!
- Saheb Maghsoodloo*Saheb Maghsoodloo*Email: [email protected]IFP Energies Nouvelles, 1 et 4 Avenue de Bois-Préau, 92852 Rueil-Malmaison, Cedex, FranceMore by Saheb Maghsoodloo
- Tri Dat Ngo*Tri Dat Ngo*Email: [email protected]IFP Energies Nouvelles, 1 et 4 Avenue de Bois-Préau, 92852 Rueil-Malmaison, Cedex, FranceMore by Tri Dat Ngo
- Jean-Charles de Hemptinne*Jean-Charles de Hemptinne*Email: [email protected]IFP Energies Nouvelles, 1 et 4 Avenue de Bois-Préau, 92852 Rueil-Malmaison, Cedex, FranceMore by Jean-Charles de Hemptinne
- Edouard MoineEdouard MoineFives ProSim, 51 Rue Ampère, Immeuble Stratège A, 31670 Labège, FranceMore by Edouard Moine
- Shu Wang
- Bjorn Maribo-MogensenBjorn Maribo-MogensenHafnium Laboratories, Vestergade 16, Third Fl., 1456 Copenhagen, DenmarkMore by Bjorn Maribo-Mogensen
- Emrah Altuntepe
- Salvador Asensio-DelgadoSalvador Asensio-DelgadoSyensqo, 85 Av des Frères Perret, 69190 Saint Fons, FranceMore by Salvador Asensio-Delgado
- Stephanie Peper
- Andrés González de CastillaAndrés González de CastillaBayer, Kaiser Wilhelm-Allee 3, 51373 Leverkusen, GermanyMore by Andrés González de Castilla
- Pascal Ferrari
- Ellen Steimers
- Susanna Kuitunen
Abstract
Electrolyte systems are characterized by their (i) strong nonideal behavior requiring advanced thermodynamic models, (ii) reactive components necessitating knowledge of formation properties, and (iii) multiphase nature, which demands robust reactive algorithms. These complexities are crucial in industrial applications, leading to the creation of the Joint Industry Project (JIP) EleTher, which aims to promote further academic exploration and provide recommendations for parametrizing such systems. To better understand interactions in electrolyte systems, the study focuses on quaternary systems comprising water, an acid, a base, and a cosolvent. This approach isolates pH effects from the dielectric constant influences. Due to limited data, only ternary subsystems were analyzed. The study evaluated the accuracy of three approaches: full dissociation (FD), no dissociation (ND), and partial dissociation (PD). While FD and ND approaches performed adequately for vapor–liquid equilibrium, they failed when speciation became significant. The PD approach, though more accurate, revealed challenges with parameter optimization as multiple local minima resulted in varying species distributions. A hybrid approach combining FD, ND, and PD models is recommended for achieving the most physically meaningful results. The study utilized the eNRTL method CPA equation of state within in-house tools (Carnot and ATOUT) to conduct the analysis.
This publication is licensed for personal use by The American Chemical Society.
Special Issue
Published as part of Journal of Chemical & Engineering Data special issue “In Honor of Frederico W. Tavares”.
Introduction
no agreement in the scientific community about the best model to use for combined long-range and short-range interactions. The industrial models used to date often have a very large number of parameters. (13,14)
The presence of chemical equilibrium implies the need to work with reactive algorithms searching for a global minimum (phase and chemical). (15)
Depending on the system as well as pressure and temperature ranges, different types of phase equilibria can occur (a vapor, one or several liquid phases, or one or several solid phases), which obviously modify the way properties of interest are addressed. As a result, a robust reactive flash algorithm is required for phase stability analysis to take all possible changes in phase equilibria into consideration. (16)
Given the complexity of the industrial systems, the reference experimental data are often insufficient for accurate process design, meaning that data extrapolation are predictive methods may be needed.
no dissociation (ND) calculations where all species in the system are in molecular form.
FD (Full dissociation) calculations considering only the ionic form of salt species.
PD (Partial dissociation) calculations that consider reaction equilibrium between molecules and ions.
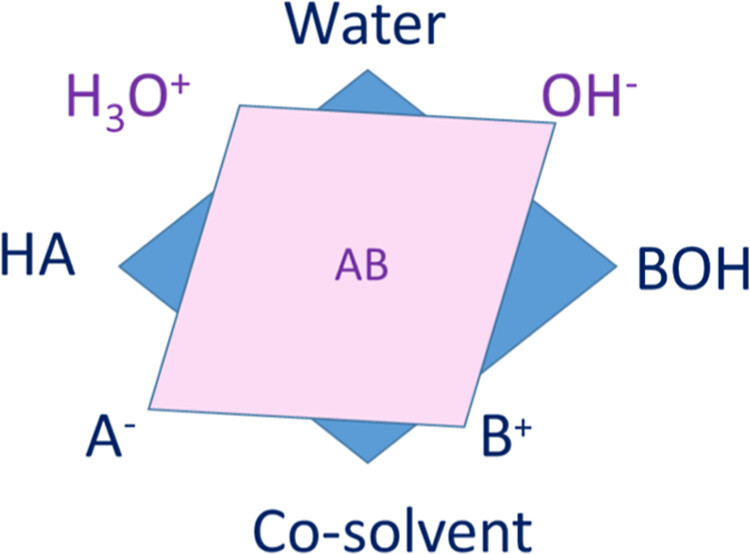
Figure 1
Figure 1. Schematic representation of the selected quaternary system, which turns out to be a nine-component system due to the reactive equilibria. HA and BOH stand for acid and base, respectively.
Experimental Data
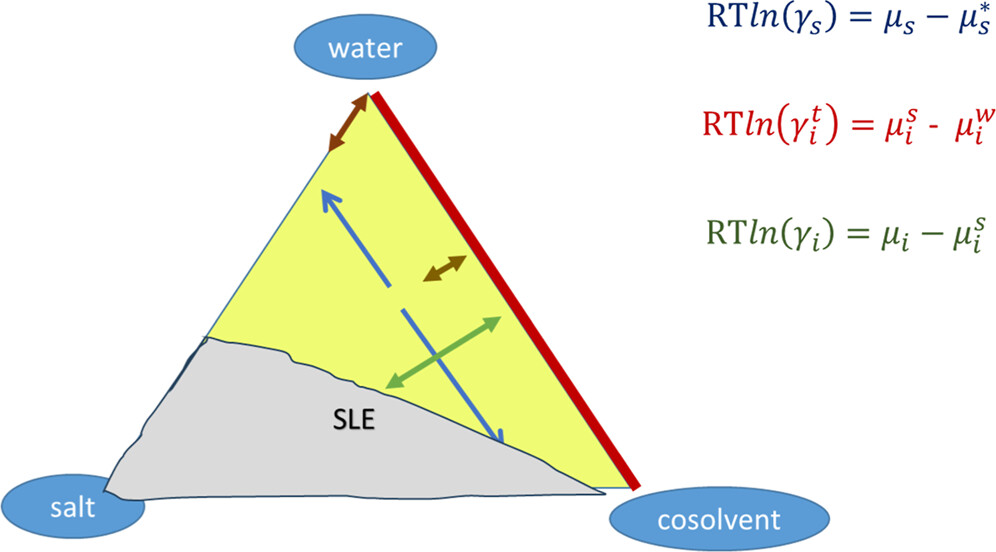
Figure 2
Figure 2. Three types of activity coefficients for a ternary system containing water, a cosolvent, and a salt: (i) blue, solvent activity coefficients; (ii) red, transfer activity coefficient of the ions between pure water and mixed solvent; (iii) green, conventional ionic activity coefficient. The orientation of the arrows shows the type of derivative of the Gibbs energy that they correspond to. SLE stands for solid–liquid equilibrium. The definitions of the variables can be found in the text.
Physical Phase Equilibrium
Existing Data
| system | typea | reference | T/K | P/bar | salt molality/molal | NPb | ||
|---|---|---|---|---|---|---|---|---|
| binary | W + MeOH | VLE-isotherm | xyP | (24−26) | 298.15–413.15 | N/A | 24, 11, 22 | |
| W + HAc | VLE-isotherm | xyP | (27−29),b | 298.15–333.15 | N/A | 13, 28, 9 | ||
| MeOH + HAc | VLE - isotherm | xyP | (30–32) | 298.15–361.49 | 0.02–1.79 | N/A | 70 | |
| W + KAc | MIAC | (33,34) | 298.15 | 0.1–3.5 | 11, 24 | 35 | ||
| VLE-isobar | xT | (35) | 373.15–384.15 | 1 | 0.358–8 | 23 | ||
| VLE-isotherm | xP | (36) | 358.15–378.15 | 0.462–1.17 | 0.756–5.26 | 26 | ||
| xP | (37) | 373.15–373.15 | 0.6–1.01325 | 0–10 | 10 | |||
| xP | (38) | 278.15–308.15 | 0.0022–0.054 | 1.133–24.1226 | 127 | |||
| W + KOH | MIAC | (34,39–42) | 298.15 | 0.001–20 | 43, 32, 11, 13, 8 | 159 | ||
| VLE isobar | xT | (43) | 373.15–613.15 | 1.013–1.013 | 0–33.443 | 45 | ||
| VLE isotherm | xP | (44) | 573.15–693.15 | 4.903–234.4 | 1.717–60.134 | 41 | ||
| xP | (37) | 373.15–373.15 | 0.496–1.01325 | 0–10 | 10 | |||
| xP | (45) | 273.15–273.15 | 0.0008–0.006 | 0.995–31.234 | 8 | |||
| xP | (46) | 293.15–298.15 | 0.002–0.03 | 1.535–23.809 | 42 | |||
| xP | (47) | 298.15–623.15 | 0.0078–157.6 | 0.8–14.261 | 76 | |||
| HAc + KAc | VLE isobar | xT | (35) | 390.55–400.75 | 1 | 0.05–1.35 | 33 | |
| MeOH + KAc | VLE isobar | xT | (48) | 338.95–346.95 | 1.0133–1.0133 | 1.039–6.23 | 4 | |
| VLE isotherm | xP | (49) | 298.15–313.15 | 0.1482–0.3574 | 0–2.511 | 24 | ||
| Ternary | W + MeOH + HAc | VLE isobar | xT | (50) | 341.08–381.64 | 1.01325 | N/A | 34 |
| VLE isobar | xyT | (51) | 350.55–377.75 | 1.01325 | N/A | 28 | ||
| W + MeOH + KAc | VLE isobar | xyT | (48) | 338.95–381.95 | 1.01325 | 1.04–6.23 | 76 | |
| W + MeOH + KOH | VLE isotherm | xyP | (52) | 298–308 | 0.923–0.983 | 1.47–7 | 18 | |
| W + HAc + KAc | VLE isobar | xyT | (35) | 373.55–398.75 | 1 | 0.18–6.77 | 96 | |
| xyT | (53) | 373.15–393.15 | 1.01325 | 1–3.06 | 15 | |||
For isobars, xyT means that both phase compositions are available; xT means that only bubble points are given. For isotherms, xyP means that both phase compositions are available; xP means that only bubble points are given.
NP: number of points available in each respective reference.
Vapor-Liquid equilibrium (VLE) data and Mean Ionic Activity Coefficients (MIAC) are used.
Experimental Activity Coefficients Illustrating the Salting In/Out Behavior
Figure 3
Chemical Equilibrium
Hydroxide Salts
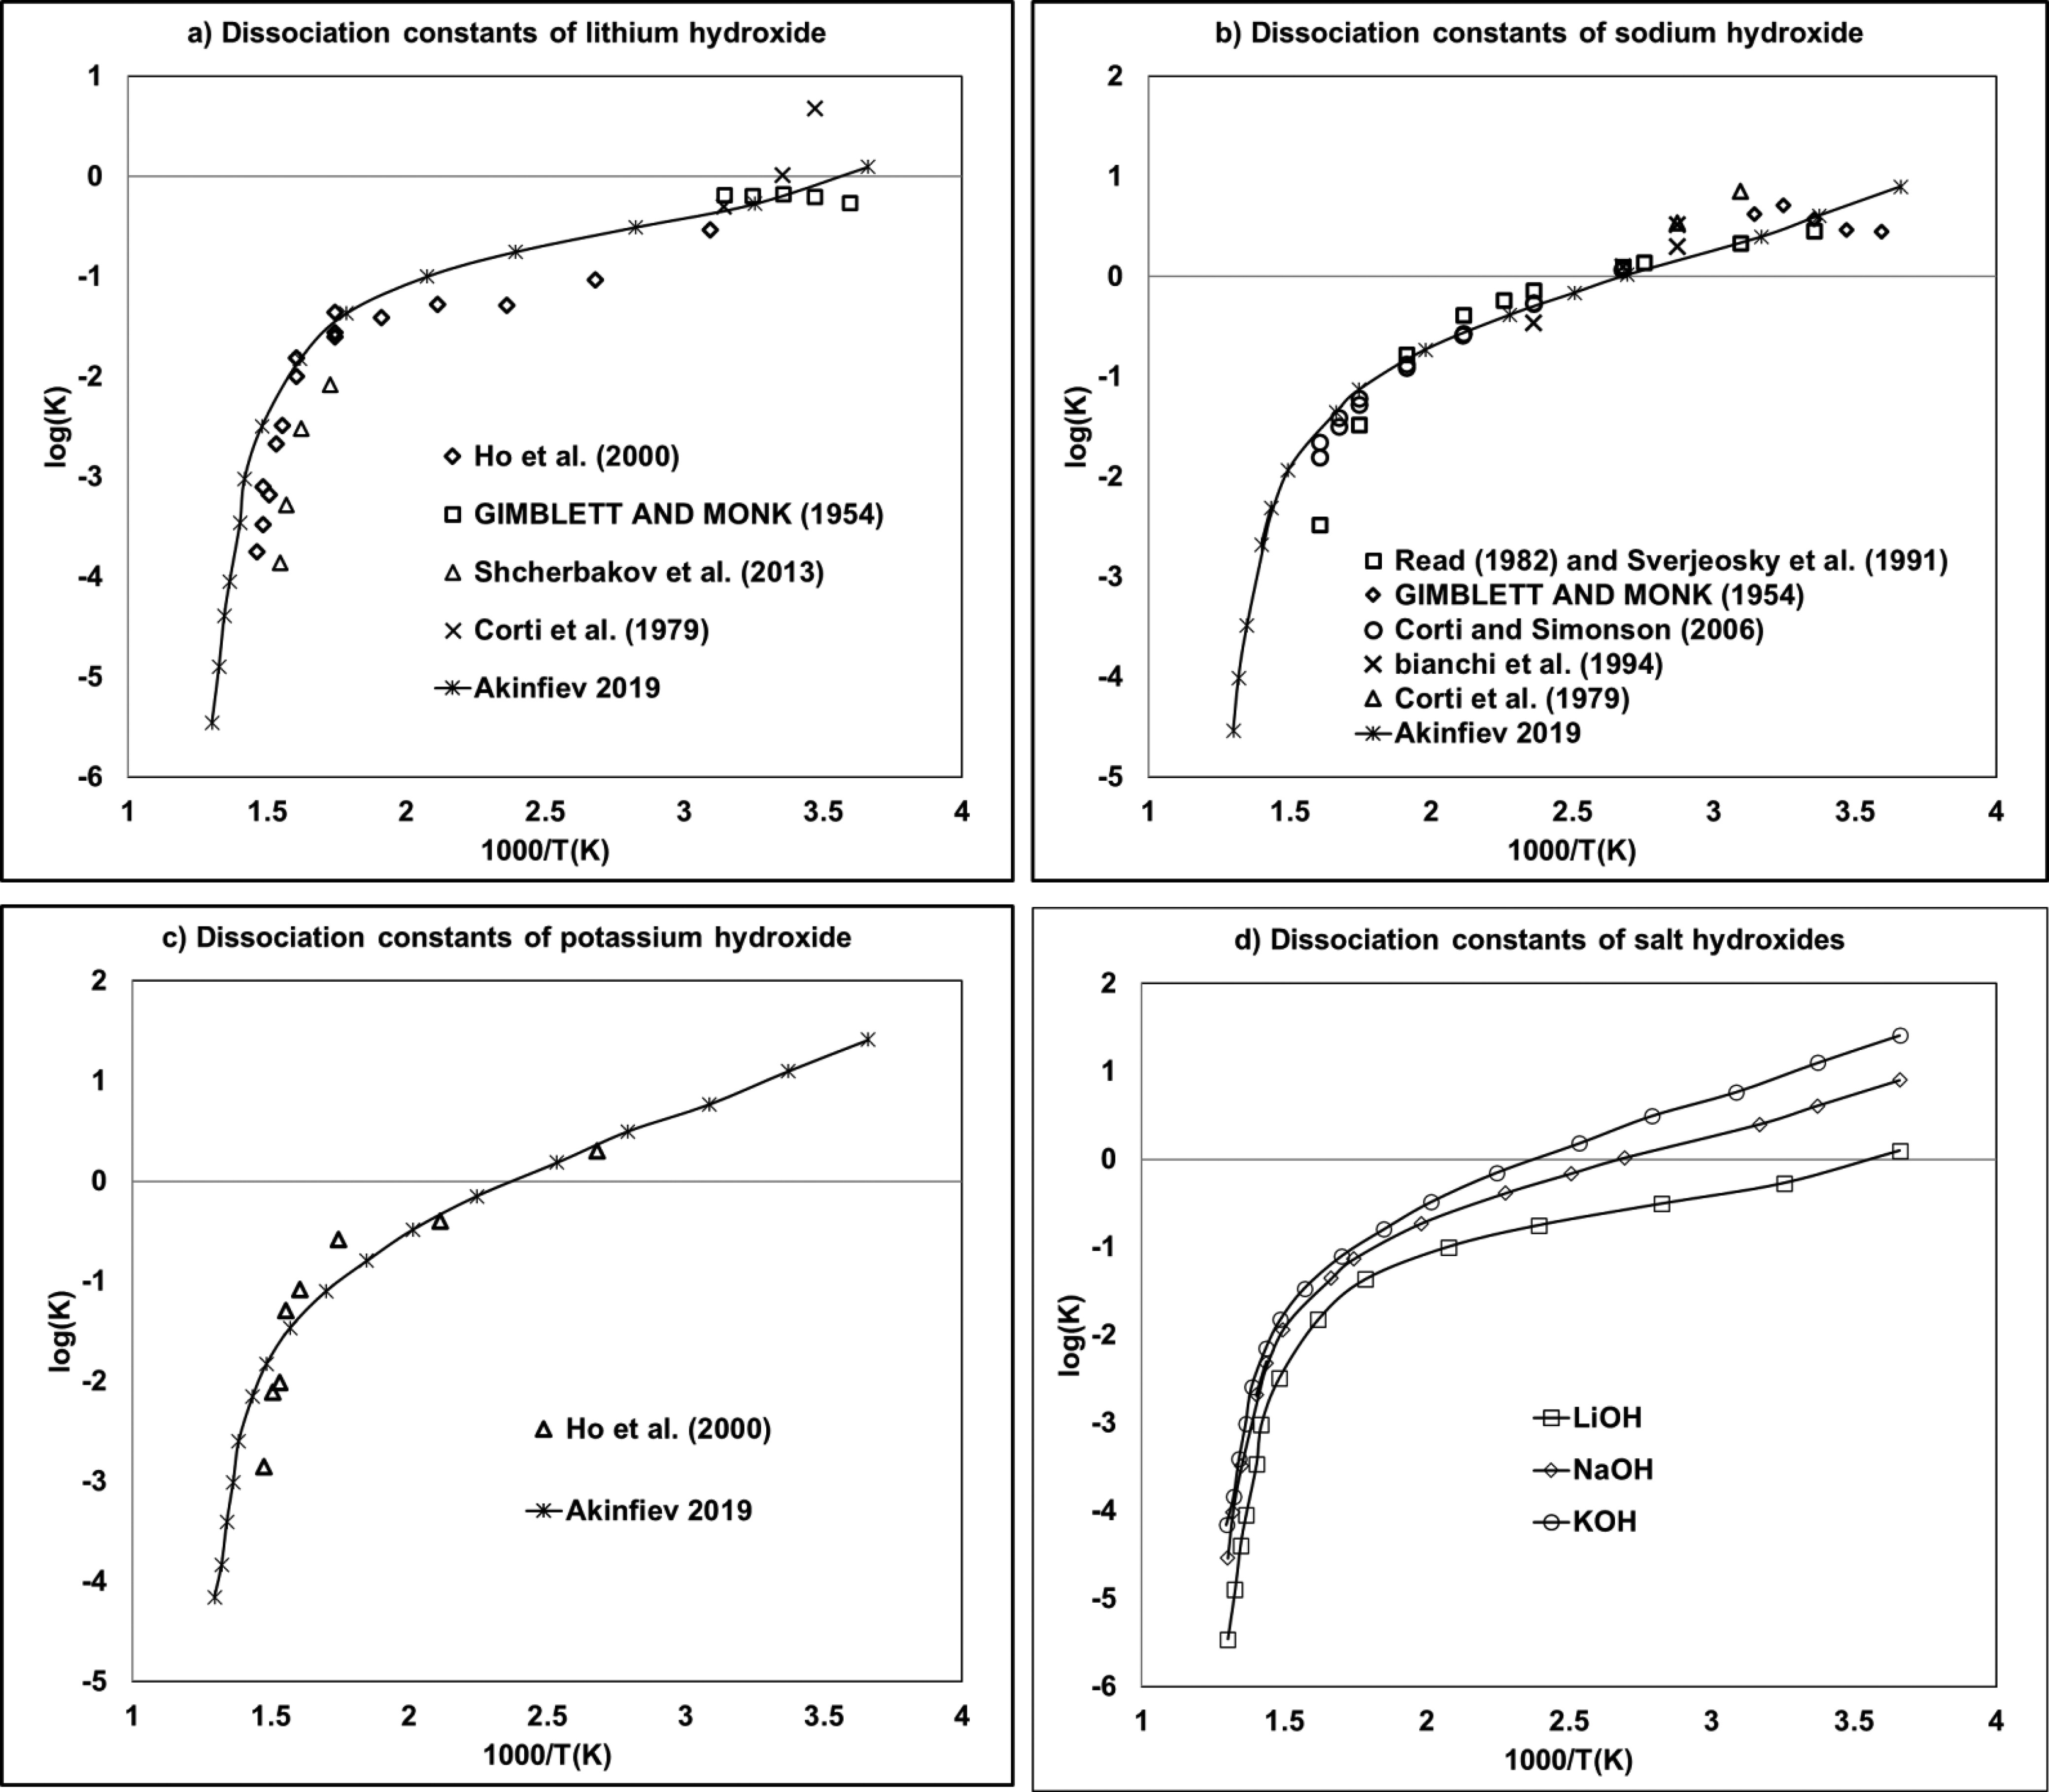
Figure 4
Figure 4. Molality-based dissociation constants of (a) lithium, (b) sodium, and (c) potassium hydroxides as a function of the inverse of the temperature. (55−65) The (d) diagram provided a comparison of (a–c) using Akinfiev-calculated data.
Acetate Salts
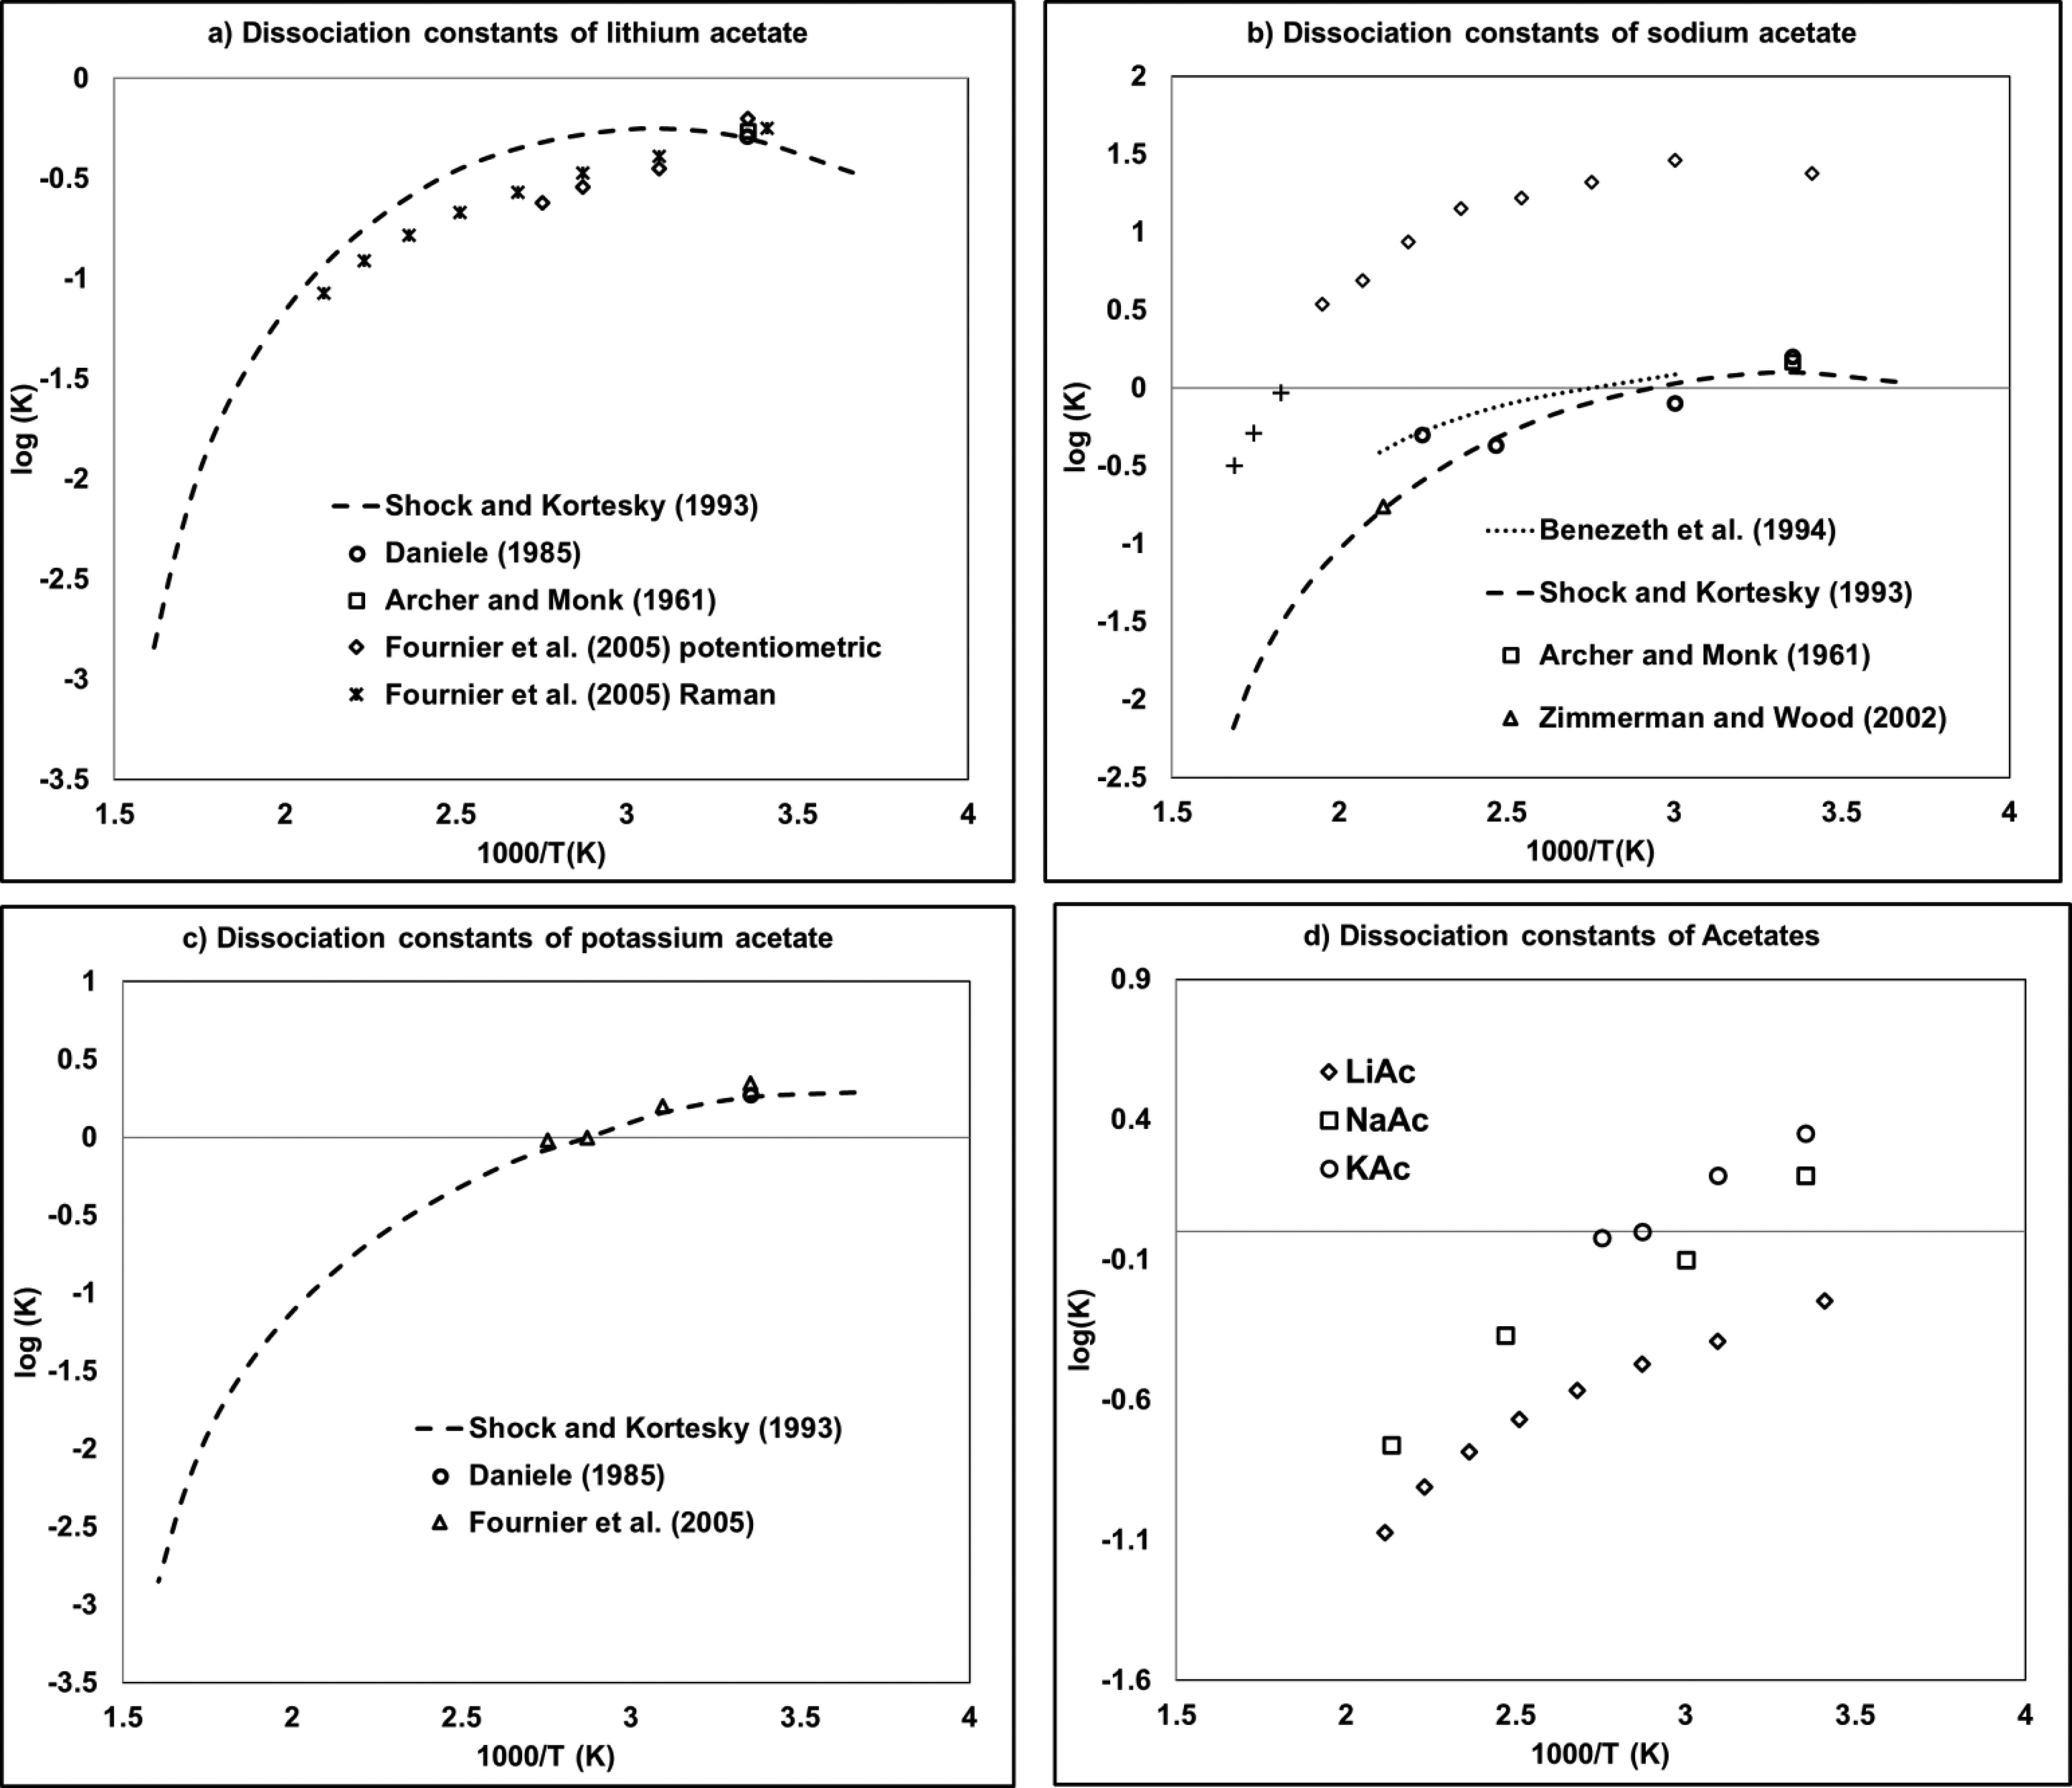
Figure 5
Figure 5. Dissociation constants of acetate salts containing (a) lithium, (b) sodium, and (c) potassium as a function of the inverse of temperature. (54,64−70) The diagram labeled (d) provides a comparison of (a–c) data.
Computational Method
Model and Adjusted Parameters
Physical Models
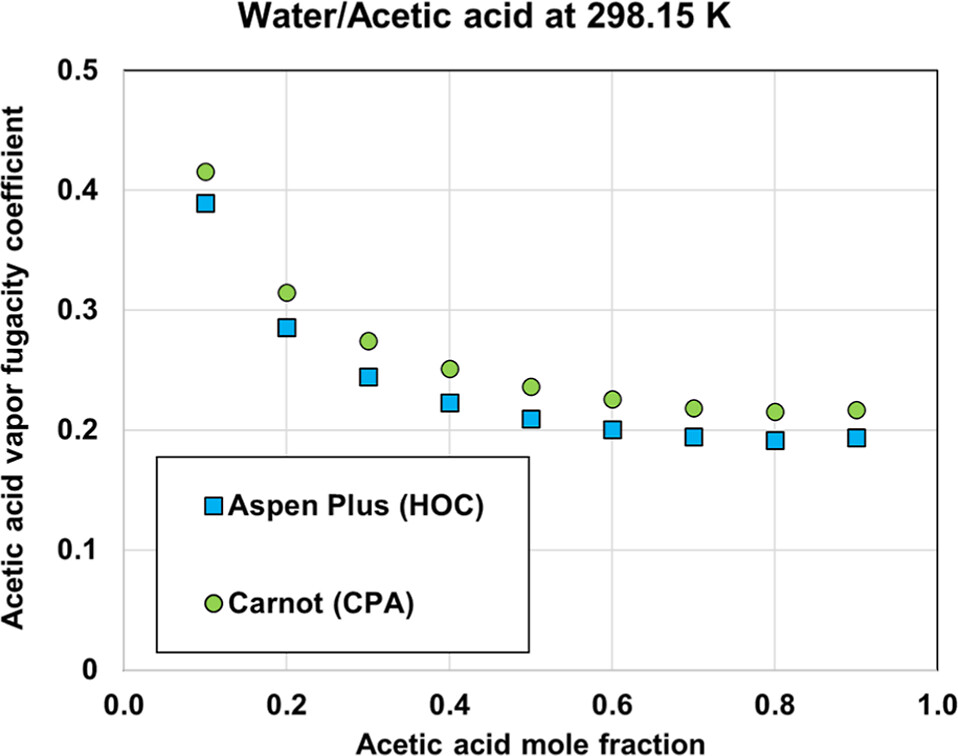
Figure 6
Figure 6. Comparison of fugacity coefficient of acetic acid in the vapor phase as predicted by HOC and CPA equations of state.
Chemical Models
| electrolyte | reaction constant | a | b | temperature range |
|---|---|---|---|---|
| H2O | K1 | –26061.1 | –46.9191 | 298–473 K |
| HAc | K2 | 28183.4 | –51.0388 | 298–373 K |
| KAc | K3 | 8052.0 | –22.6331 | 298–363 K |
| KOH | K4 | 23684.6 | –57.7287 | 373–573 K |
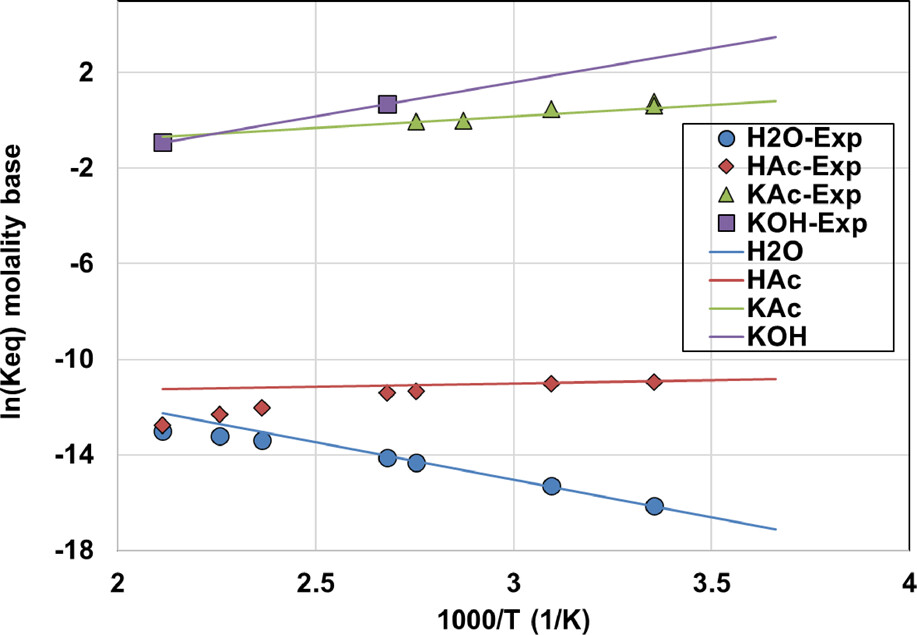
Figure 7
Figure 7. Dissociation constant as a function of temperature using eq 7, together with experimental data from ref (78) for H2O, from ref (79) for HAc, from refs (66,and67) for KAc, and from ref (57) for KOH.
Properties
Phase Equilibrium Calculation
Mean Ionic Activity Coefficient (MIAC)
pH
Parameterization of Binary and Ternary Systems
Data Selection for Parameter Regression
Numerical Issues
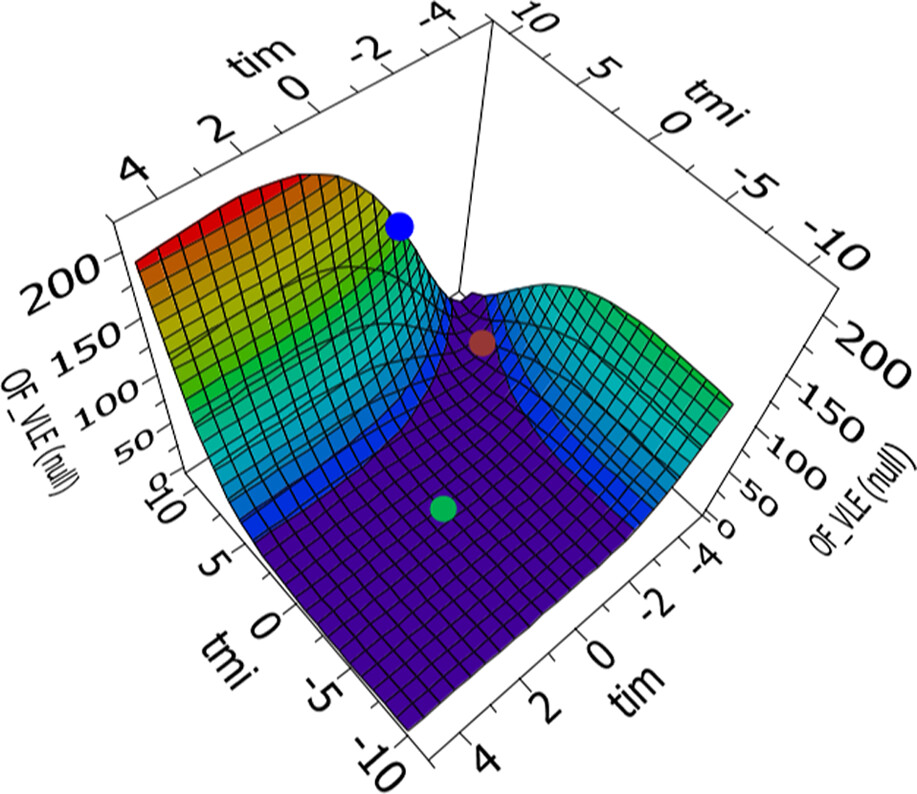
Figure 8
Figure 8. Example of response surfaces for the methanol─KAc parameter regression. The points indicate the location of different default parameter sets: [τmi, τim] = [10, −2] (blue dot), [τmi, τim] = [8, −4] (brown dot), and [τmi, τim] = [0, 0] (green dot).
1st stage: a “coarse” regression using an evolutionary algorithm solver allowing to generate potential solution candidates.
2nd stage: a “fine” regression using a solver with a quadratic approximated model to obtain the best and final parameters.
Results and Discussion
Binaries with Water
Water/KAc
Figure 9
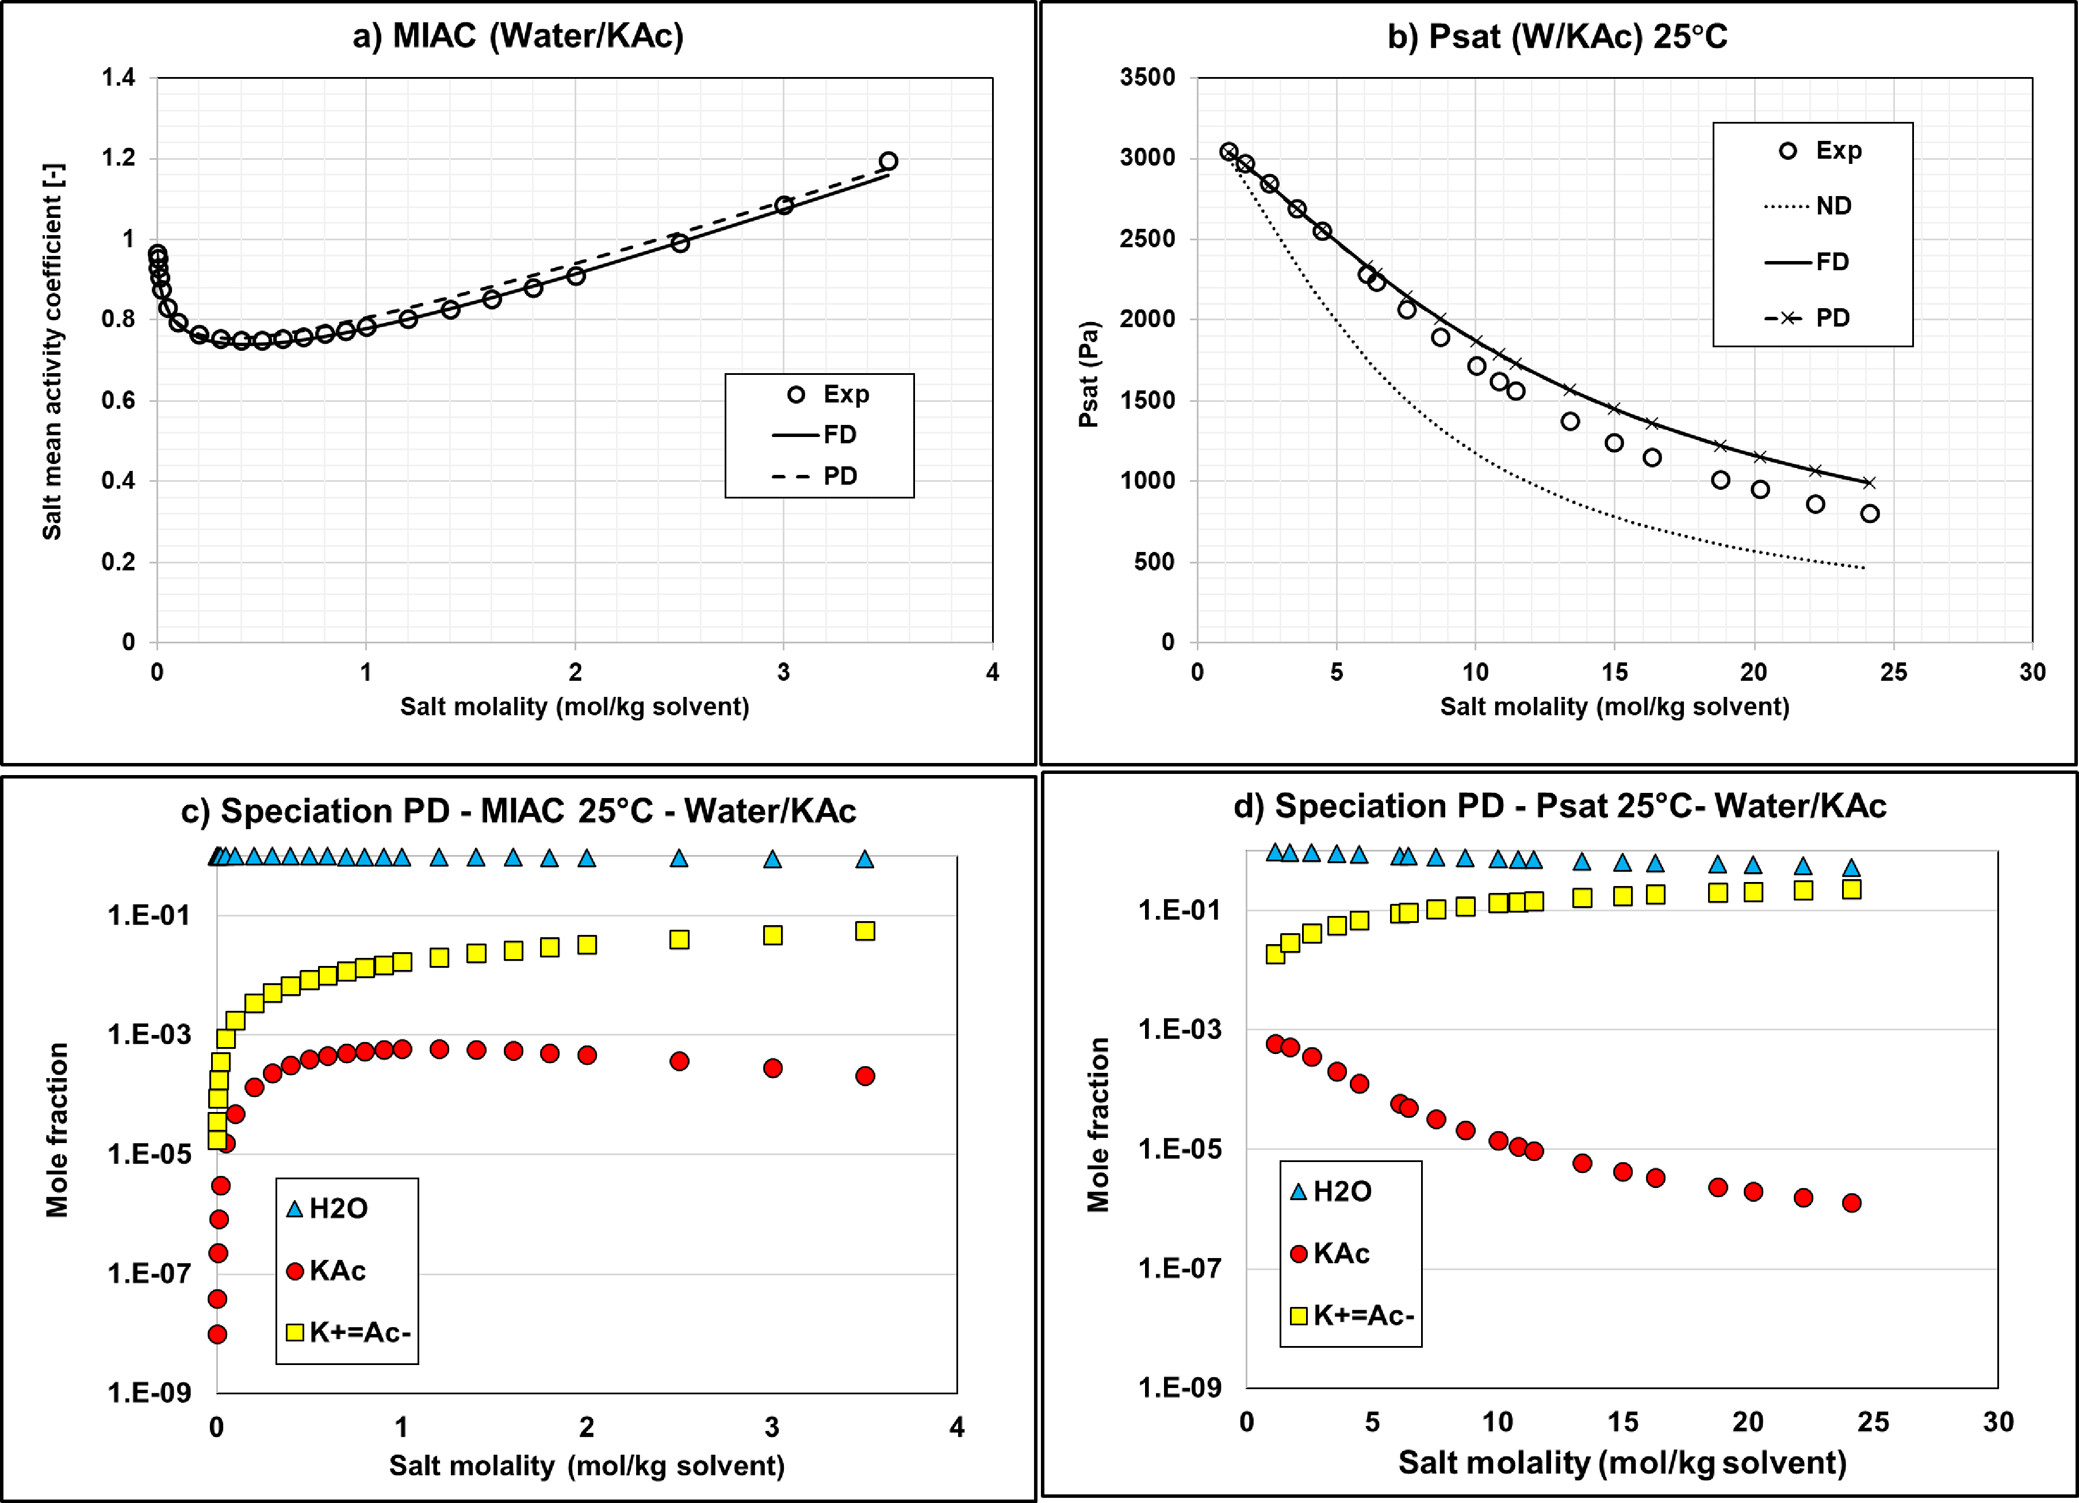
Figure 9. Mean activity coefficient (a) and vapor pressure (b) of Water/KAc mixtures at 25 °C with the default Aspen Plus parameters using Carnot. Calculation of MIAC with ND option is impossible because it requires having ions in the system. Corresponding speciations for MIAC (c) and vapor pressure (d) calculations using the PD approach. MIAC Data are extracted from ref (34) and vapor pressure data from ref (38).
Figure 10
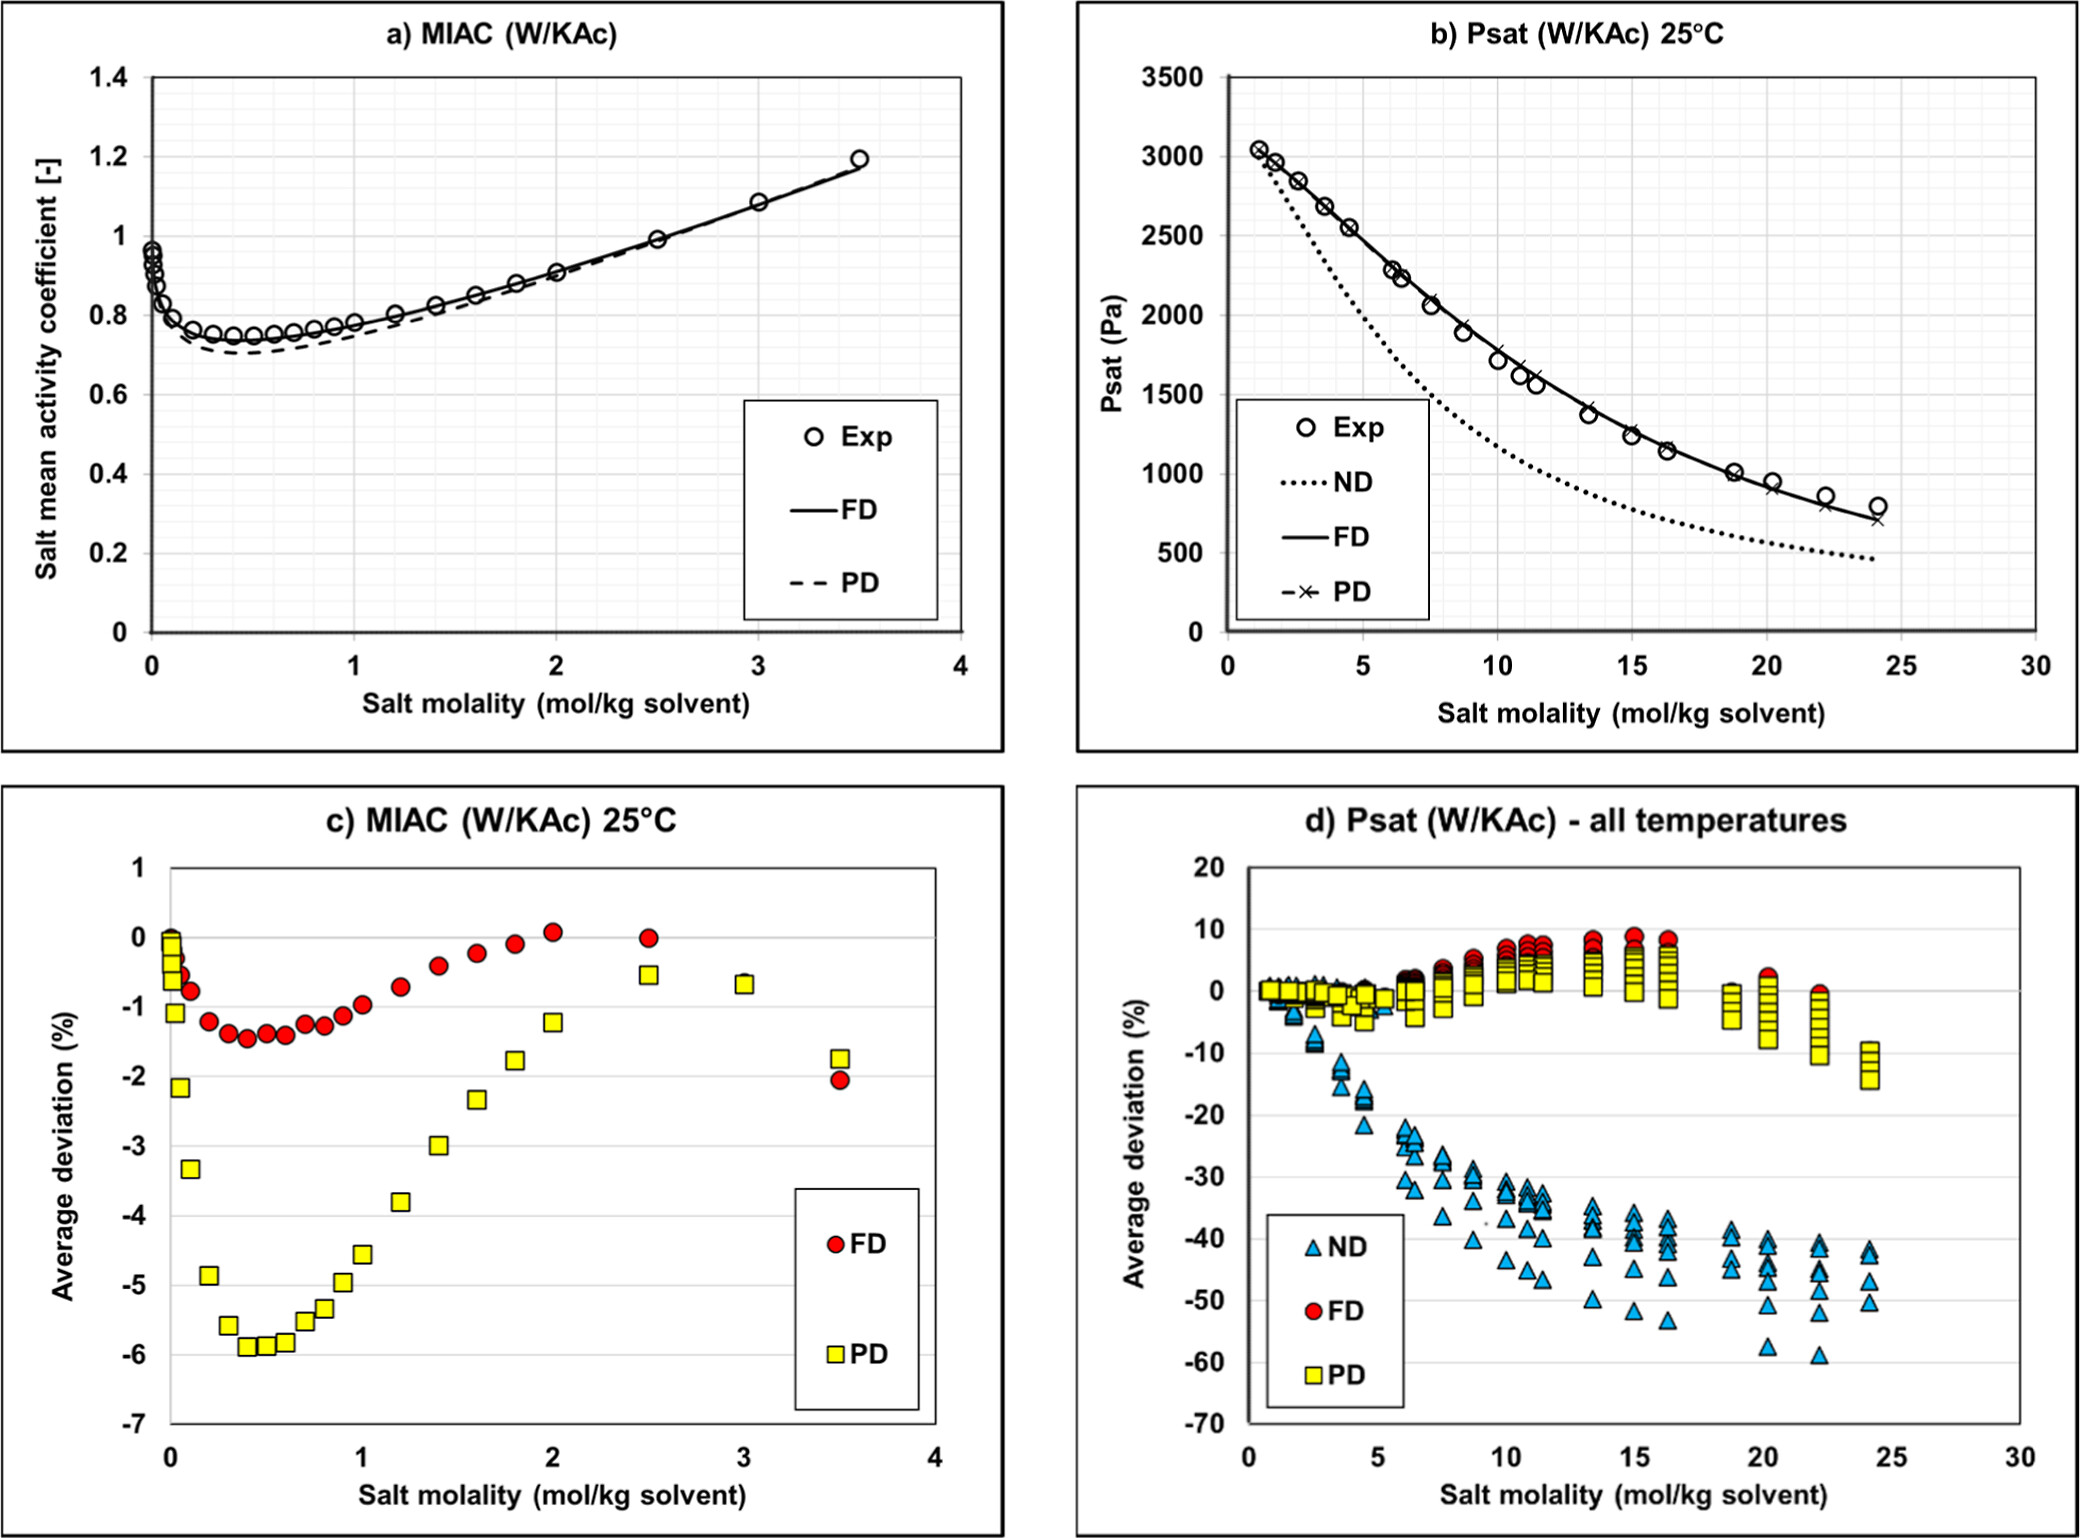
Figure 10. Mean activity coefficient (a) and vapor pressure (b) of Water/KAc mixtures at 25 °C and deviations on MIAC (c) and vapor pressure (d). Experimental data (34,36,38) and modeling results with regressed parameters.
Water/KOH
Figure 11
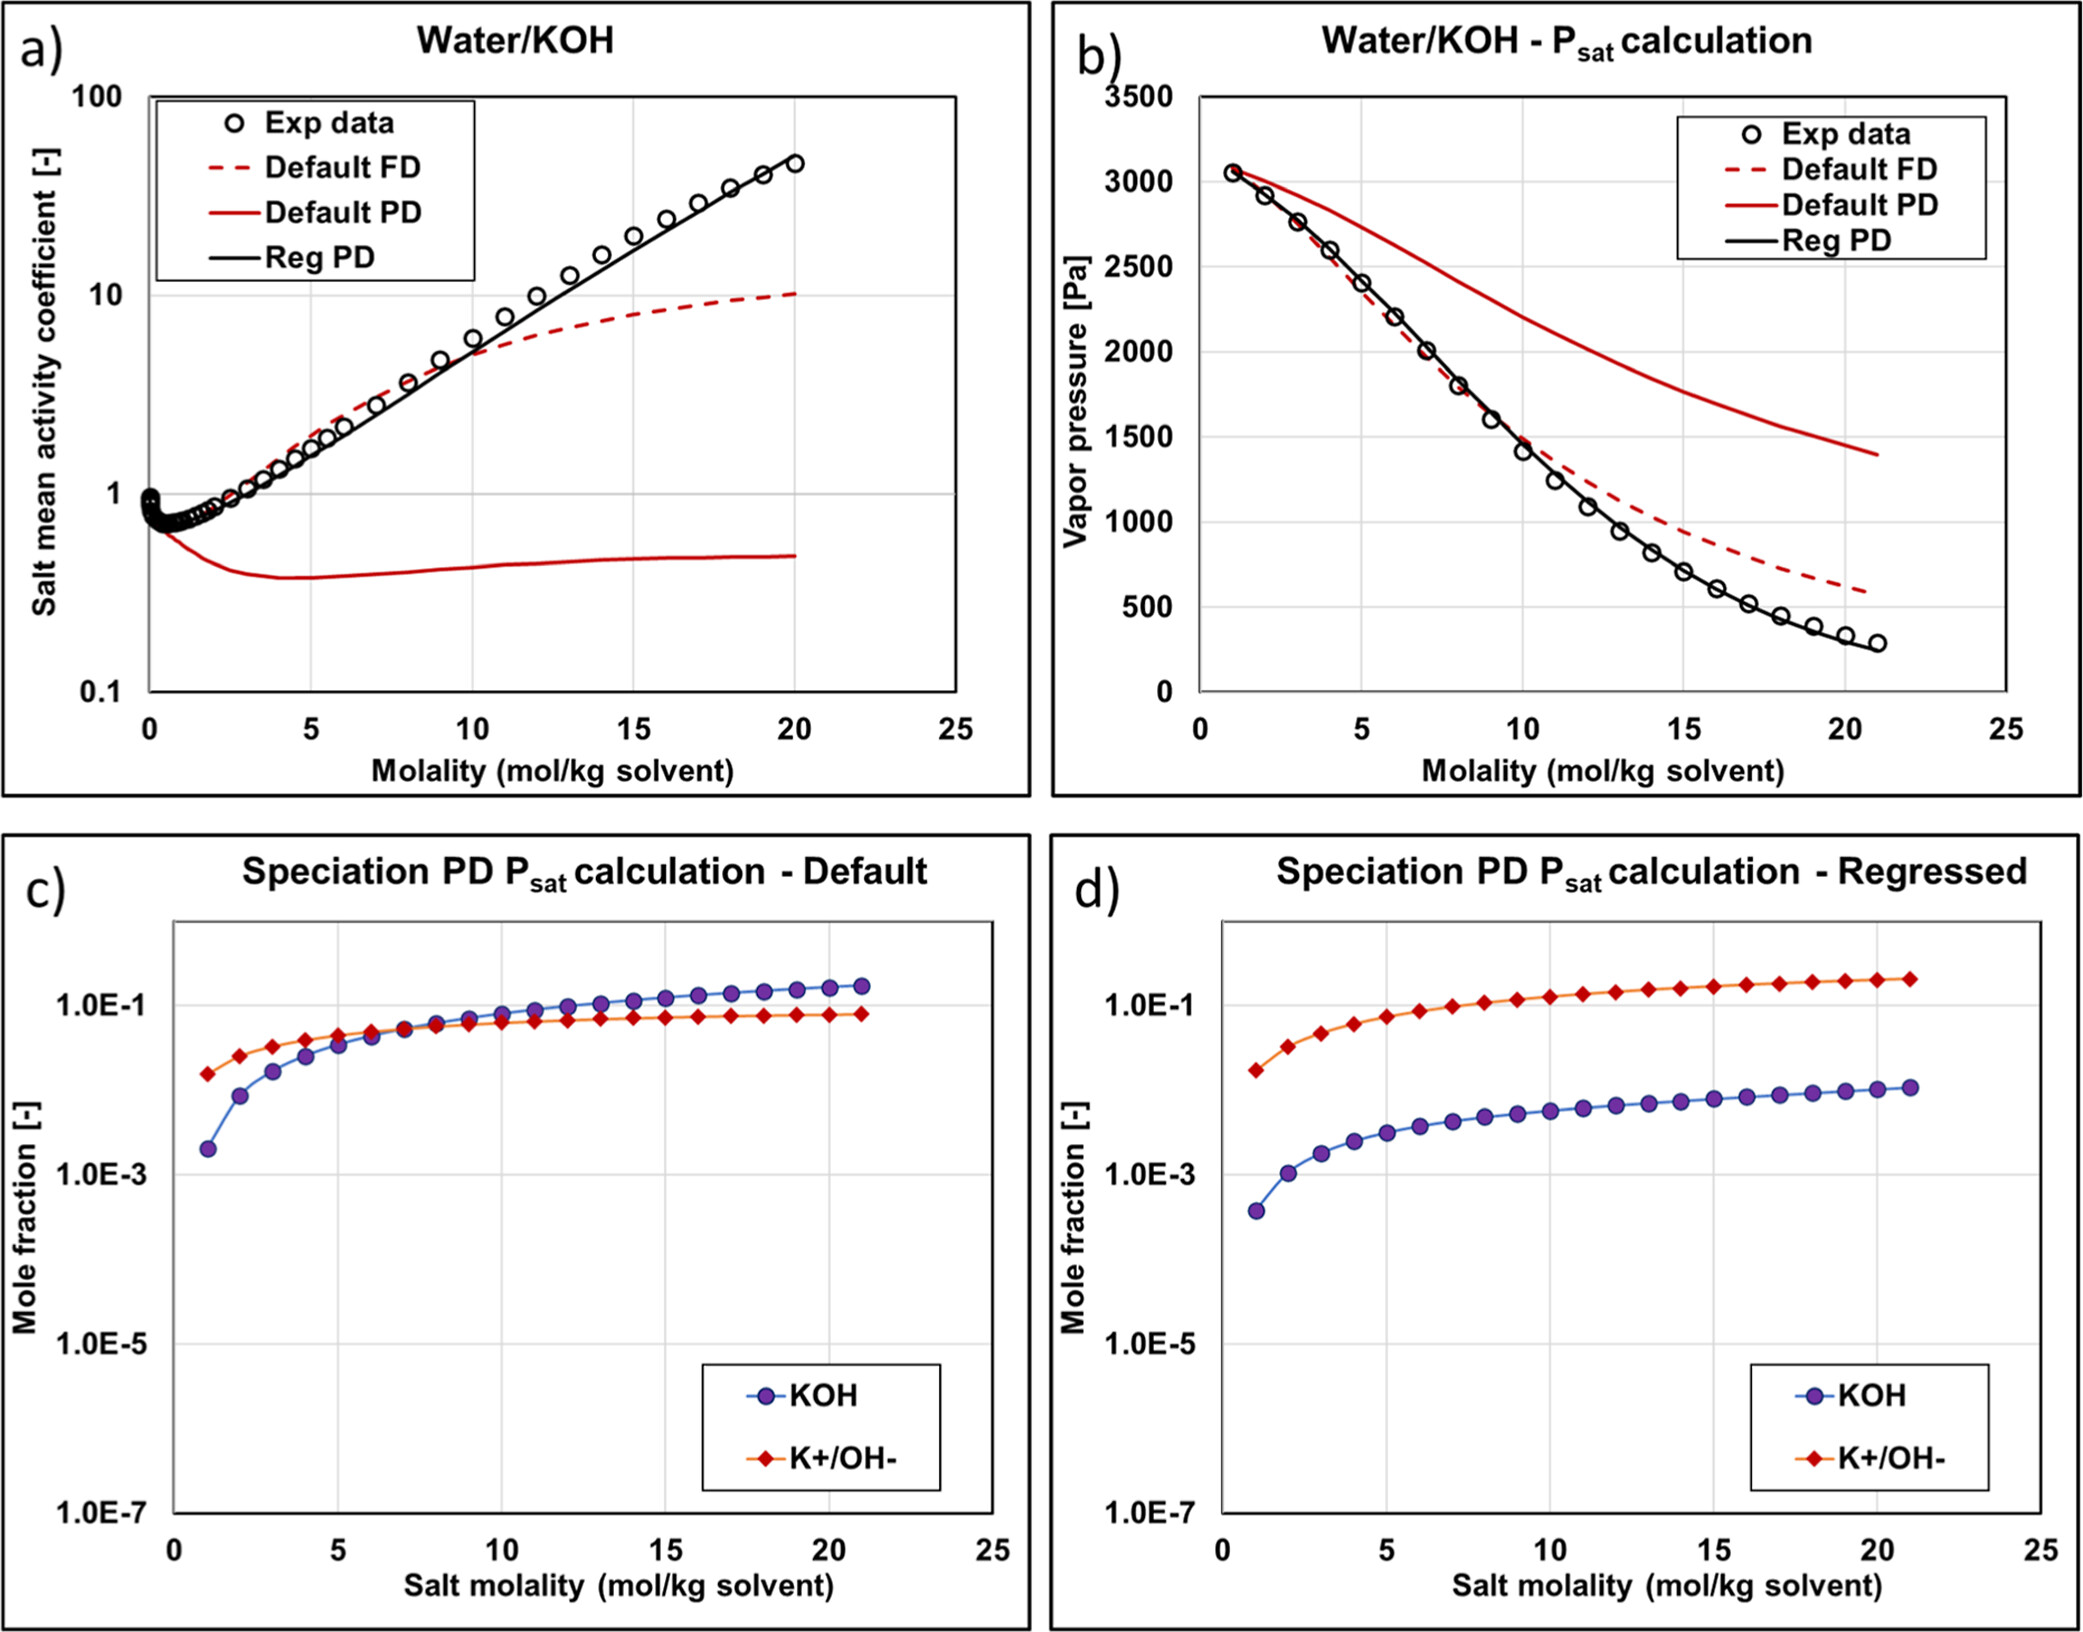
Figure 11. KOH mean activity coefficient (a) and vapor pressure (b) with different methods and parameters (experimental data are from ref (34)). Reg stands for regressed. Speciation of Psat PD calculations as a function of salt molality using default (c) and regressed (d) parameters.
Figure 12
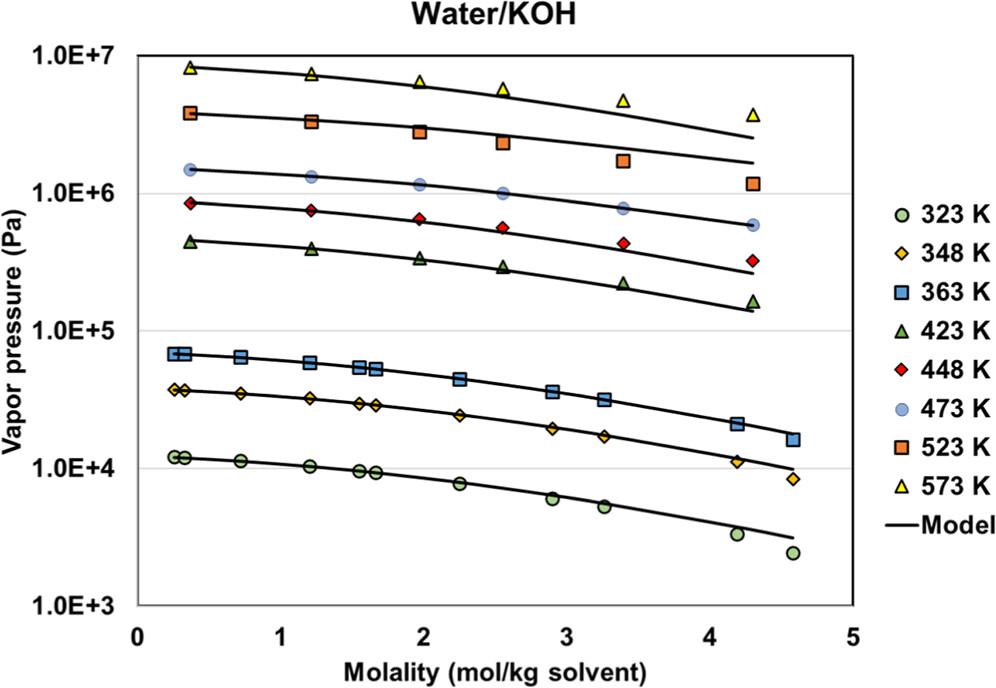
Figure 12. Vapor pressures of the water + KOH system with regressed parameters. The data are from refs (46,and47).
Systems with Methanol Cosolvent
Water/Methanol/KAc
Figure 13
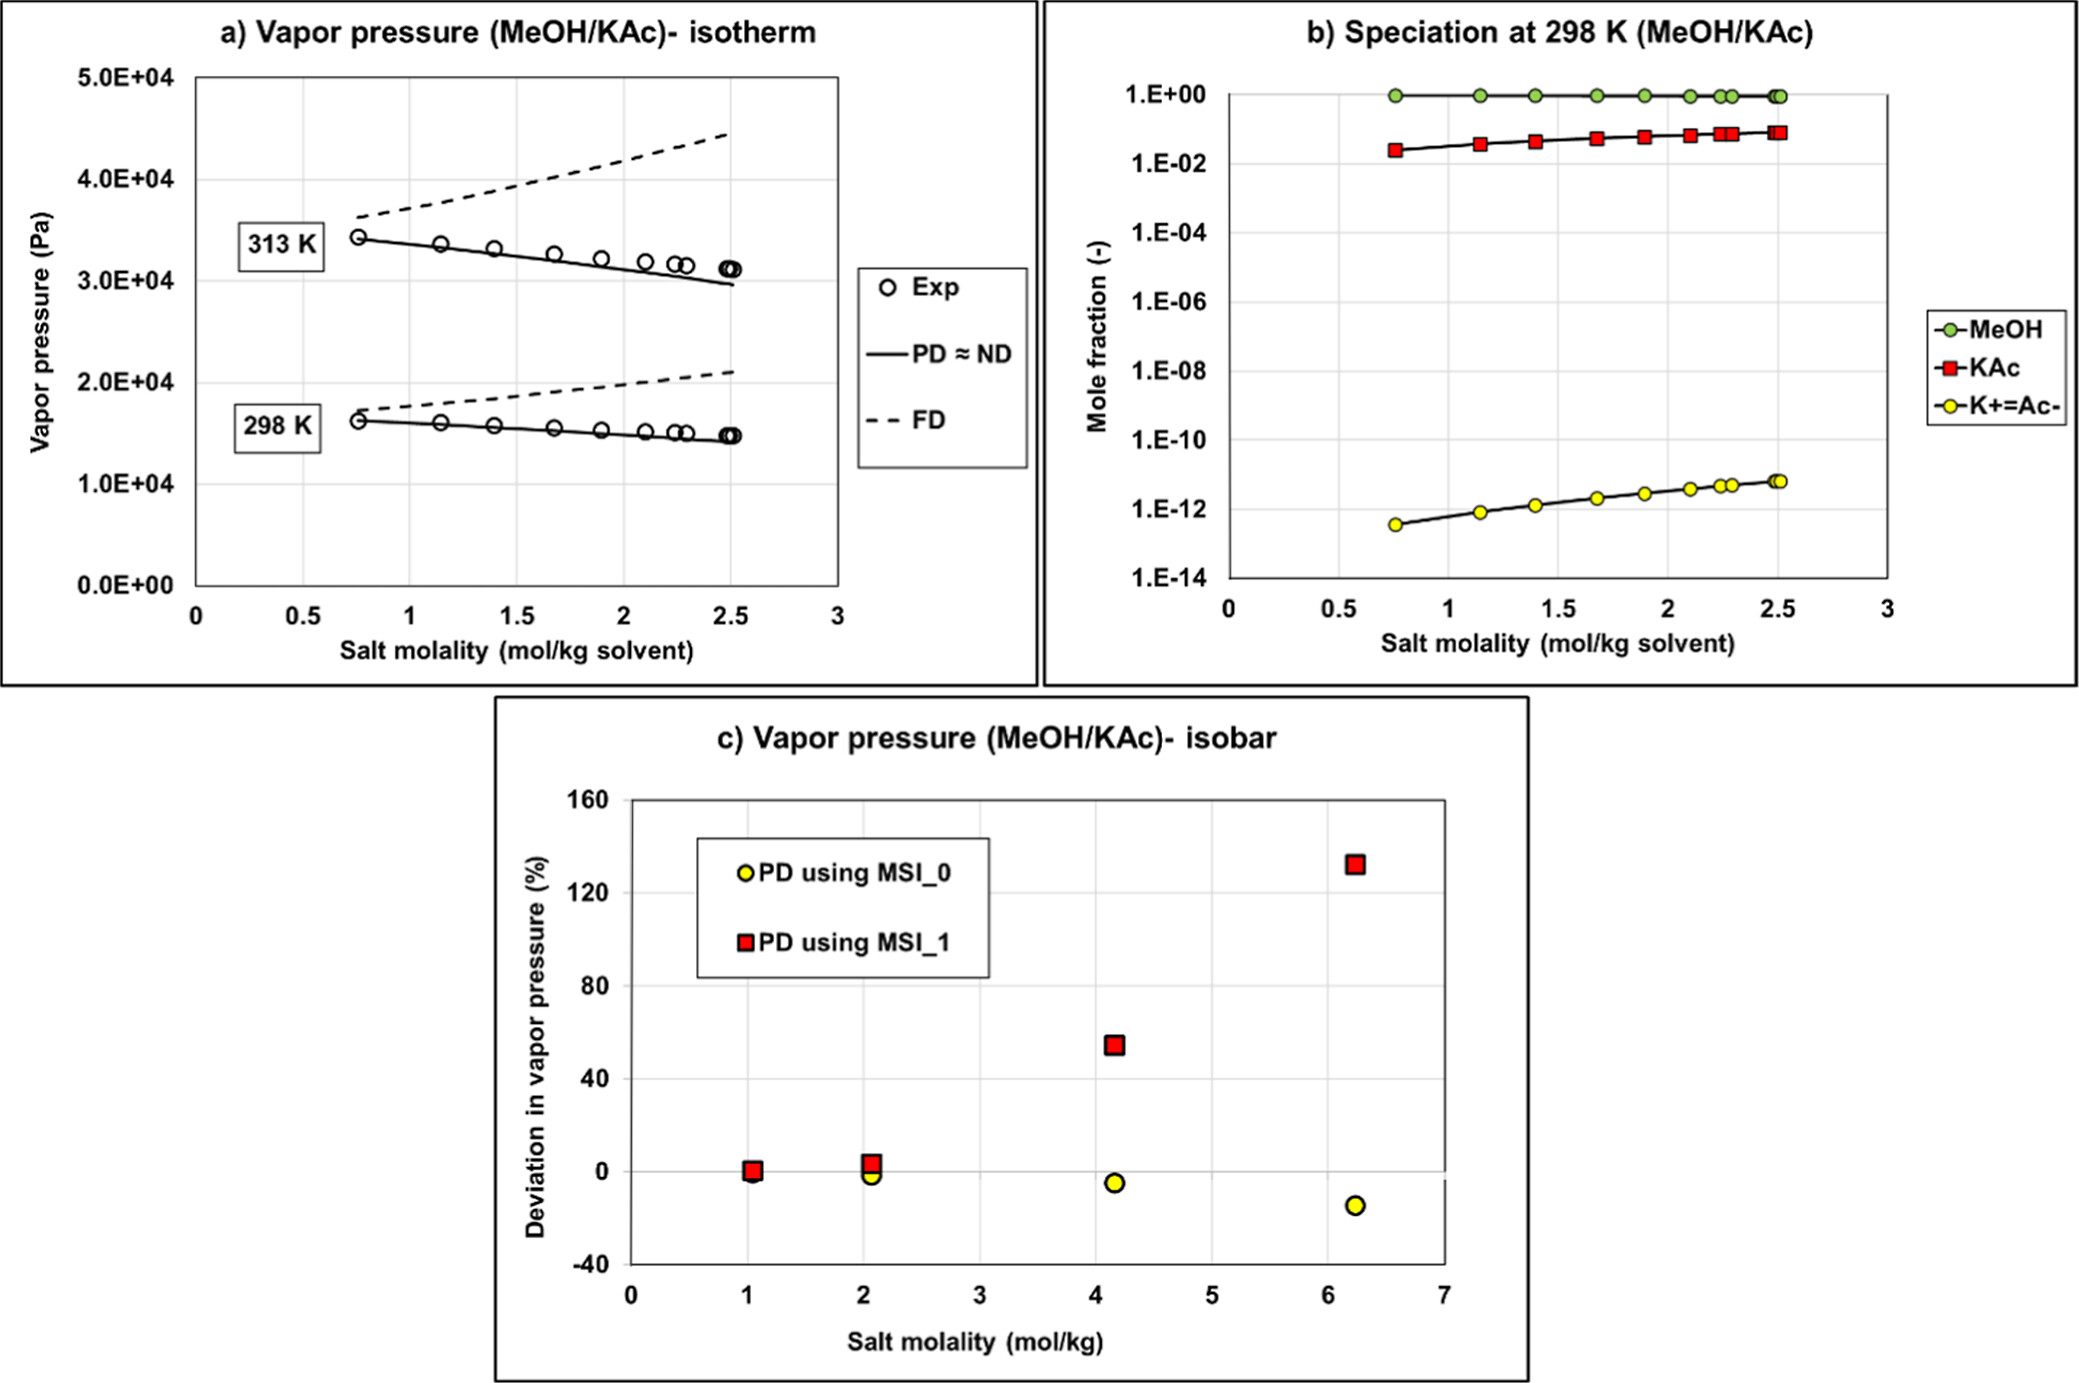
Figure 13. VLE calculation versus experimental data from refs (49and50) (a) Comparison of the methanol-potassium acetate vapor pressure (isotherm data) using the fully dissociated (FD) approach, partially dissociated (PD), or nondissociated (ND) assumptions with Aspen Plus NRTL parameters for both water/ion pair and methanol/ion pair interactions using MSI_0 set; (b) liquid speciation with PD calculation using MSI_0 set; (c) vapor pressure deviation on isobar data (1 bar) using MSI_0 and MSI_1 sets.
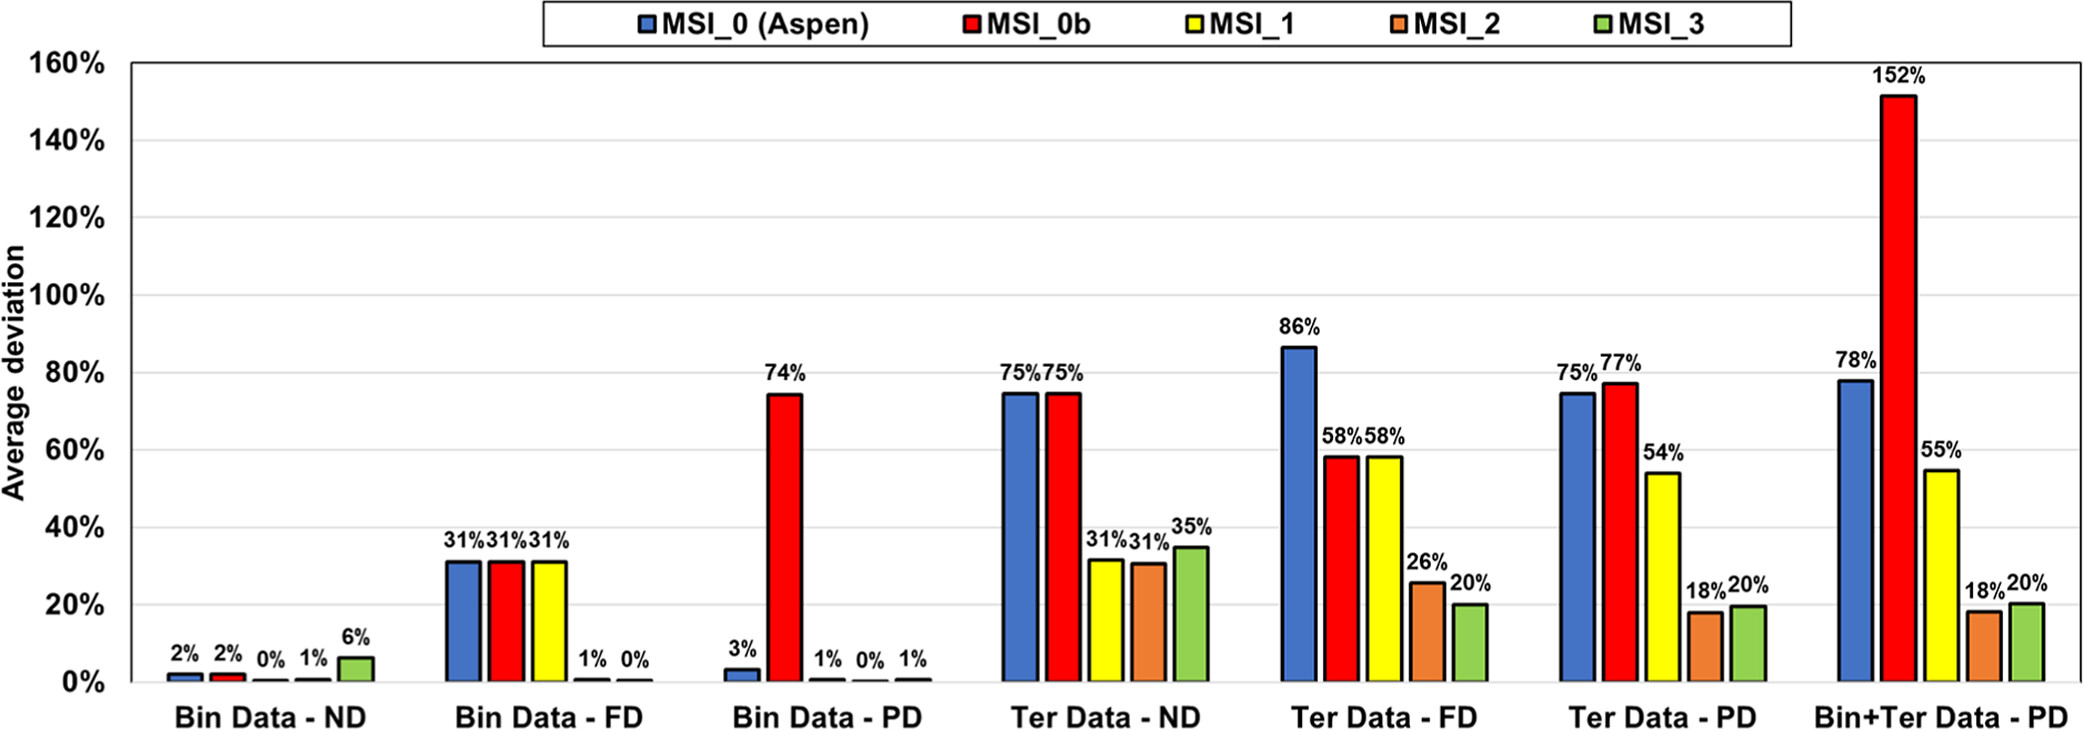
It is possible to use exclusively parameters from Aspen Plus (MSI_0, blue bars) for ND or PD on binary systems. Regarding the results for ternary systems, predictions deviate significantly from the experimental data regardless of the used approach (deviation of ∼80%).
The MSI_0b set with methanol/KAc and methanol/K+Ac– parameters from Aspen Plus and for water/K+Ac– regressed parameters is not optimal with very large deviations on binary with PD approach (Bin Data─PD) and all ternary calculations.
The regressed parameters set MSI_1 obtained from regression on the binary data set provides reliable results only in the case of ND calculation. Once salt dissociation is considered, the default parameter set (τmi, τim) = (10, −2) is no longer optimal as shown in Figure 13c.
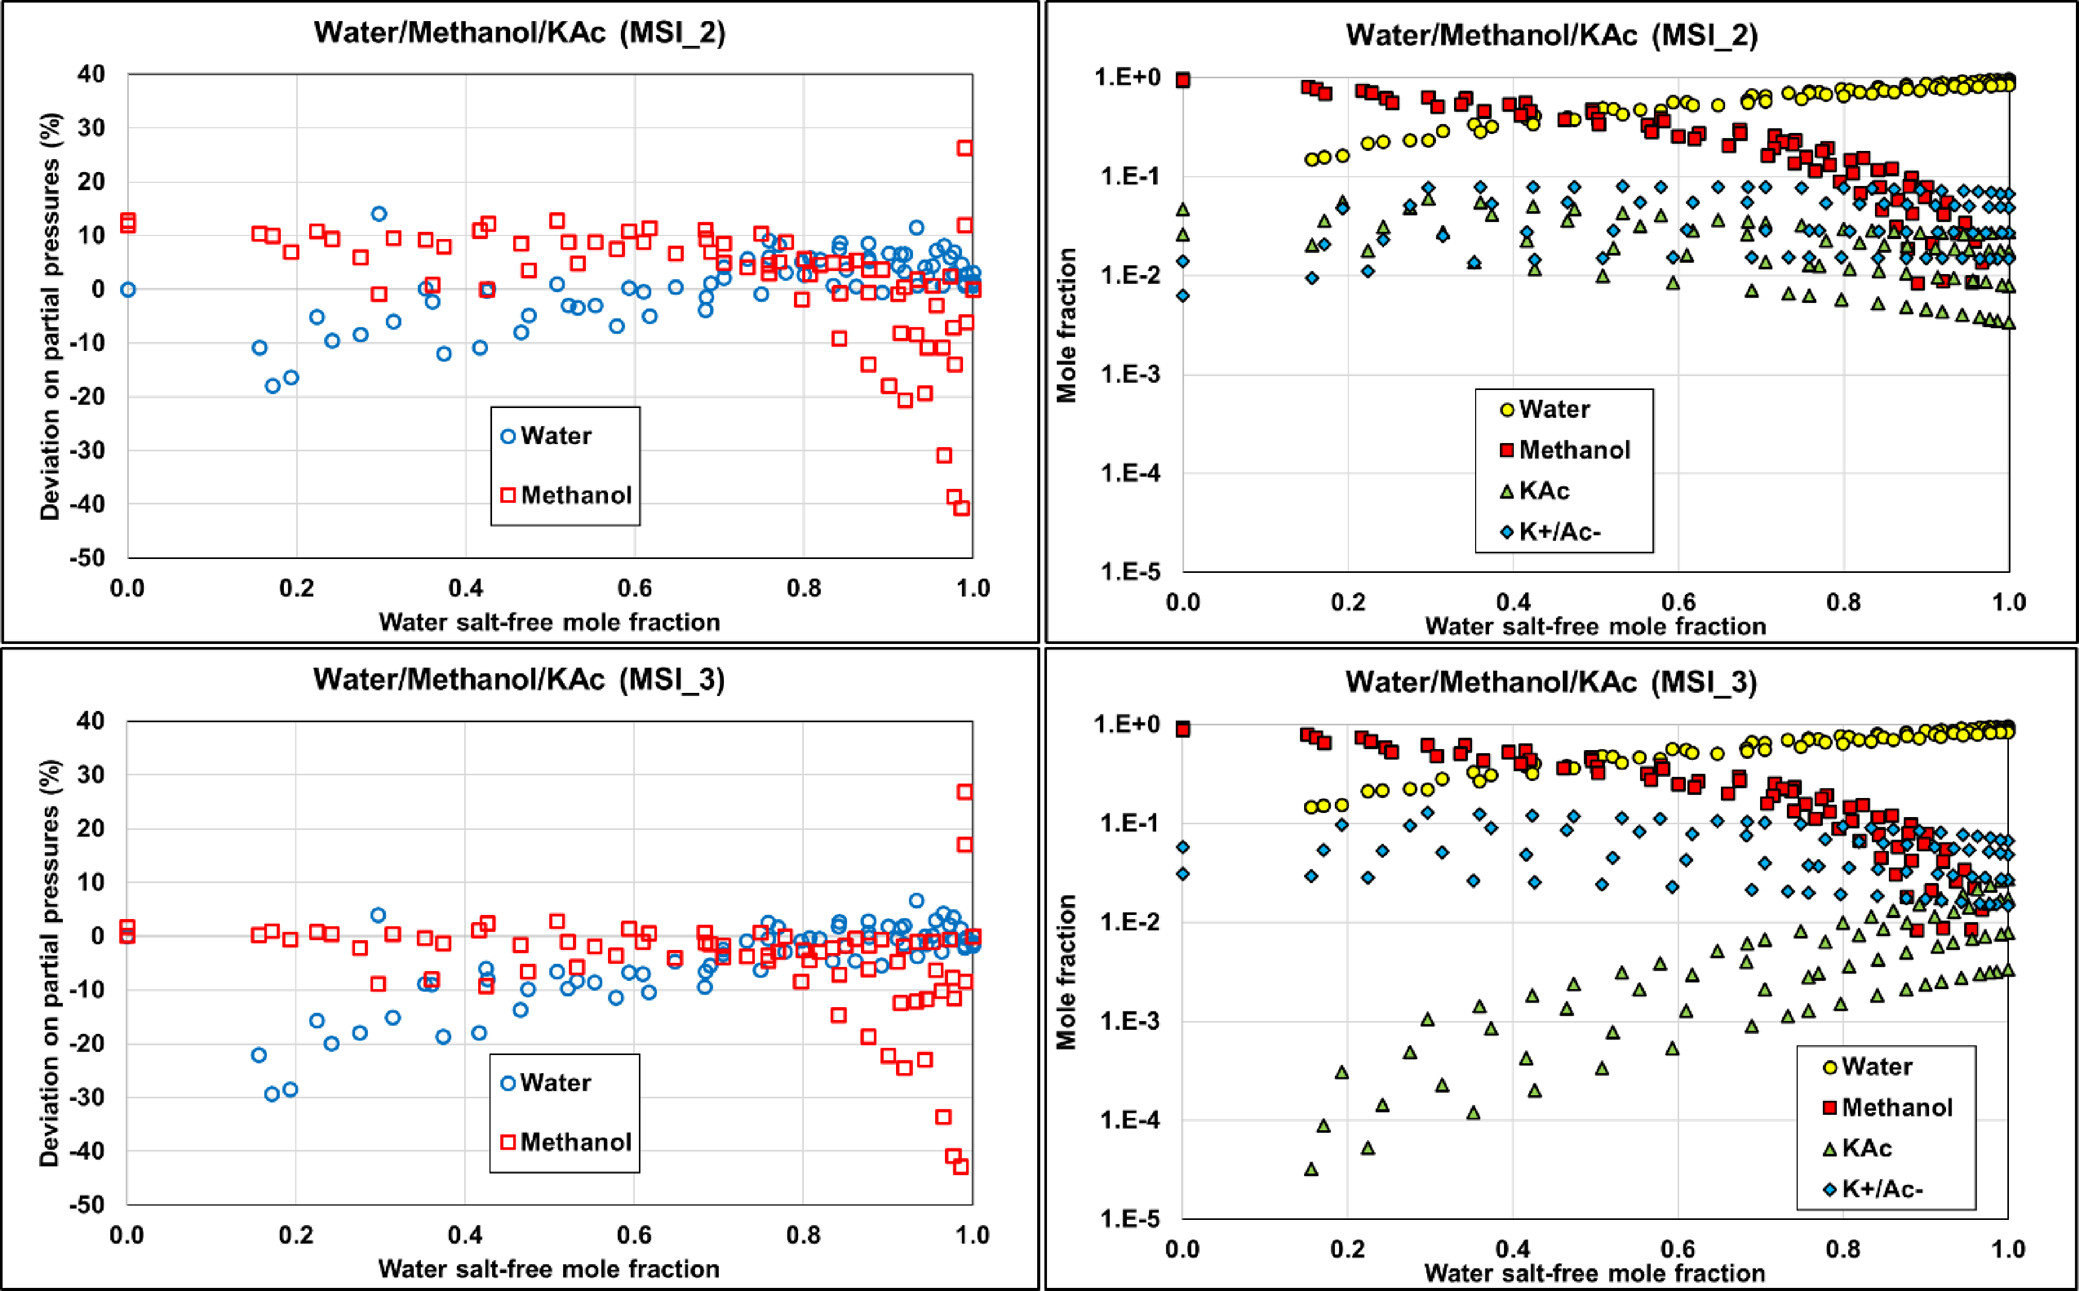
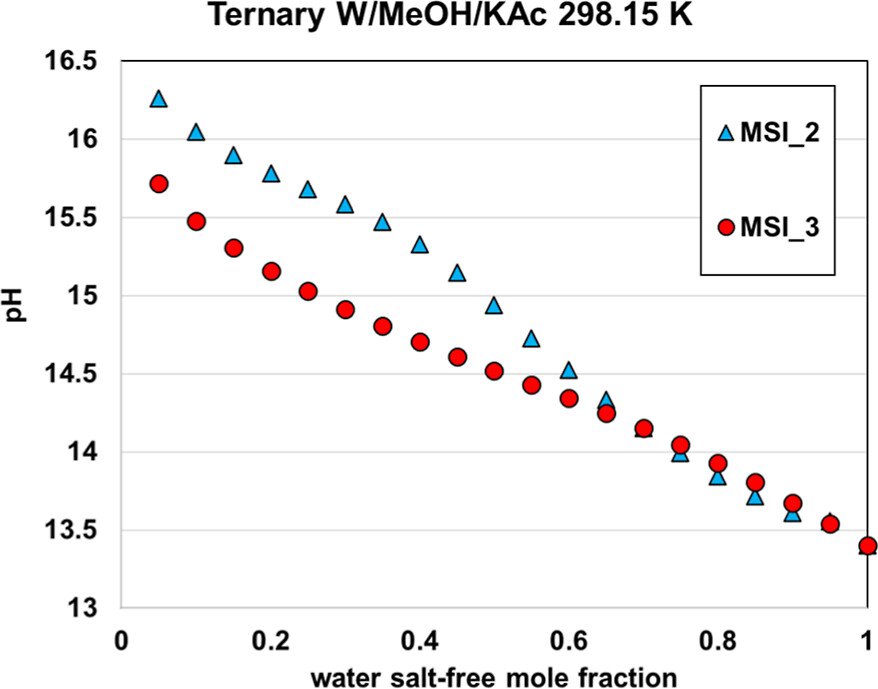
The two other parameter sets, MSI_2 and MSI_3, provide almost the same final objective function (average relative deviation) of about 18%–20%, on the ternary VLE but yield different speciation in the mixed solvent, as illustrated in Figure 15. The speciation resulting from the MSI_3 parameter set shows a strong salt dissociation in methanol, which is inconsistent within a nonaqueous solvent. In contrast, the MSI_2 parameters yield more ion pairs, which is more consistent with the expectation. This explains why MSI_2 performs better on the binary data than MSI_3 (Figure 14). Interestingly, both sets provide reasonable results for all VLE calculations. However, it should be noted that MSI_2 and MSI_3 lead to different pH values (Figure 16), especially at high methanol fraction.
Figure 14
Figure 14. Performance of different parameter sets on binary (MeOH/KAc) and ternary (W/MeOH/KAc) experimental data with ND, FD, and PD calculations. Bin and Ter stand for binary and ternary, respectively.
Figure 15
Figure 15. Comparison of the ternary W/MeOH/KAc performance on partial pressures calculations and corresponding speciation with MSI_2 (top) and MSI_3 (bottom) parameter sets at 1, 2, 4, and 6 M potassium acetate. Data are extracted from ref (48).
Figure 16
Figure 16. pH of 9% KAc in water–methanol mixed solvent at 298.15 K computed with MSI_2 and MSI_3 parameter sets.
Systems with Acetic Acid Solvent
Water/HAc/KAc
Figure 17
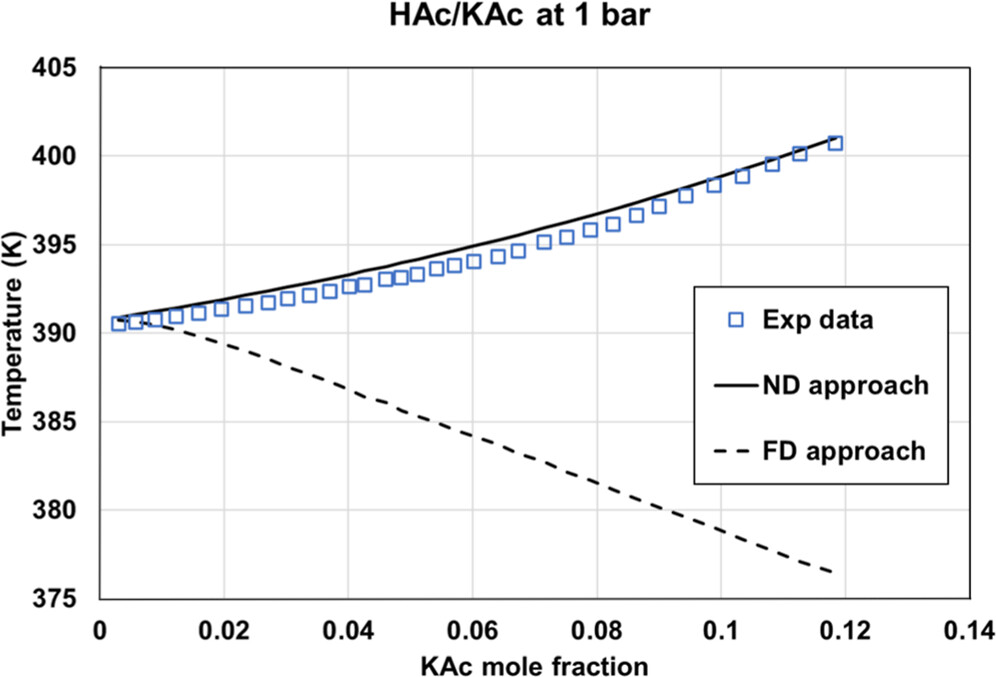
Figure 17. Comparison of the HAc/KAc bubble temperature at 1 bar, using two options: fully dissociated KAc or molecular KAc with eNRTL using ASI_0 parameter sets. Experimental data were extracted from ref (35).
ASI_0 (Aspen Plus parameters), ASI_0b (methanol/salt and methanol/ions parameters from Aspen Plus with water/ions parameters regressed in this work), and the ASI_1 parameter set regressed on the binary data set provide adequate results only in the case of ND and PD calculations on binary data. While considering salt dissociation, the default parameter set (τai, τia) = (0,0) is not optimal.
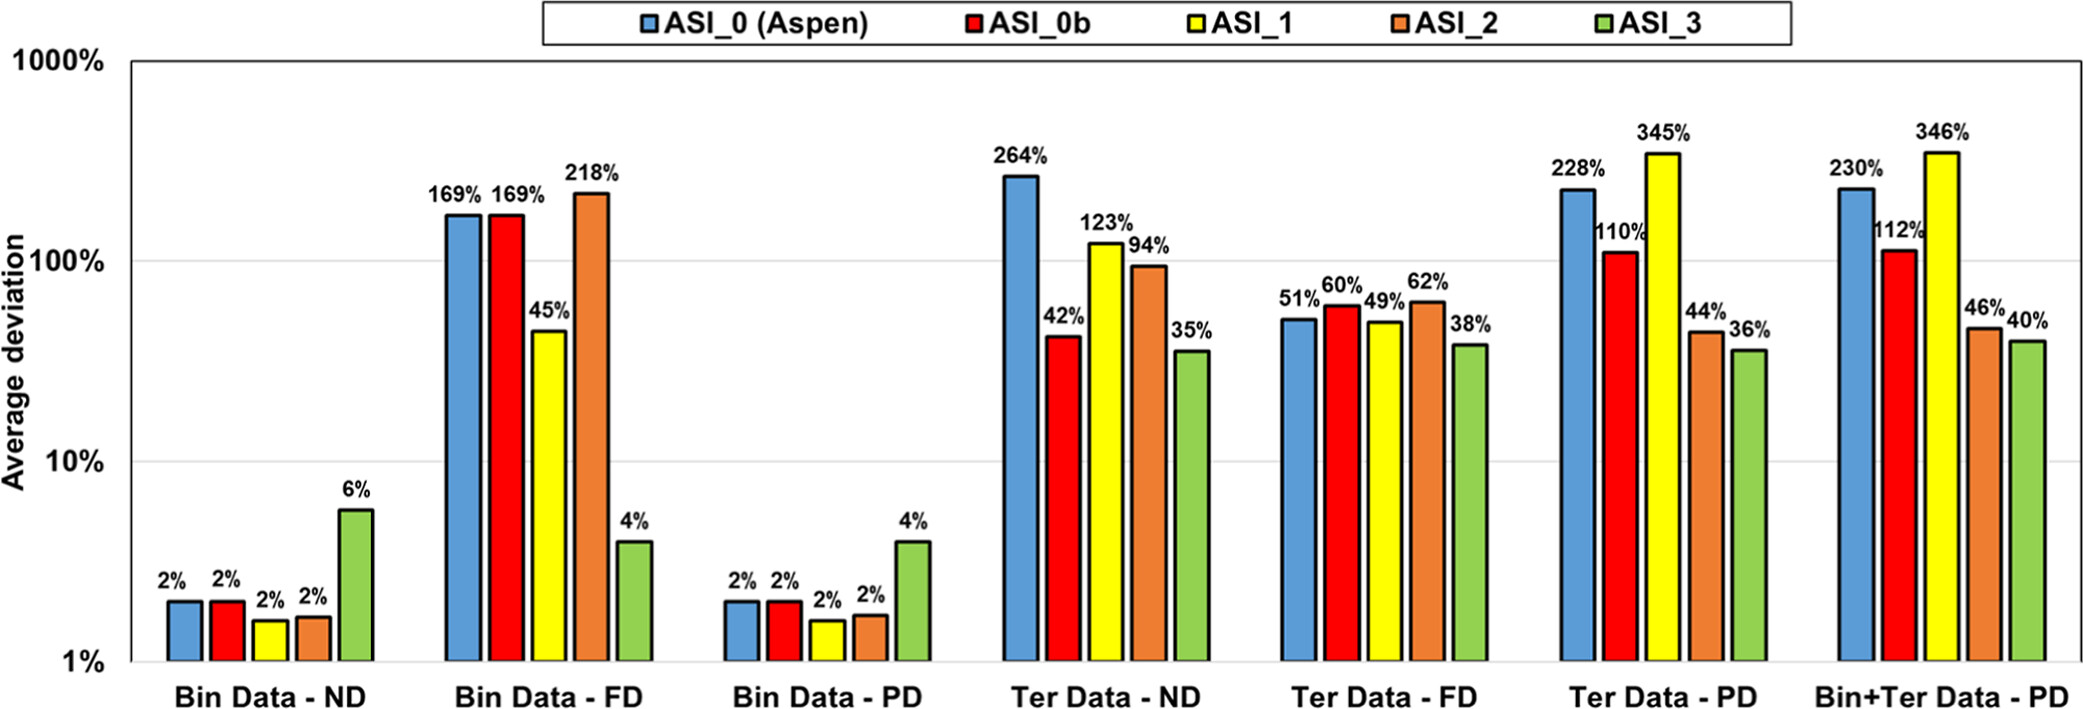
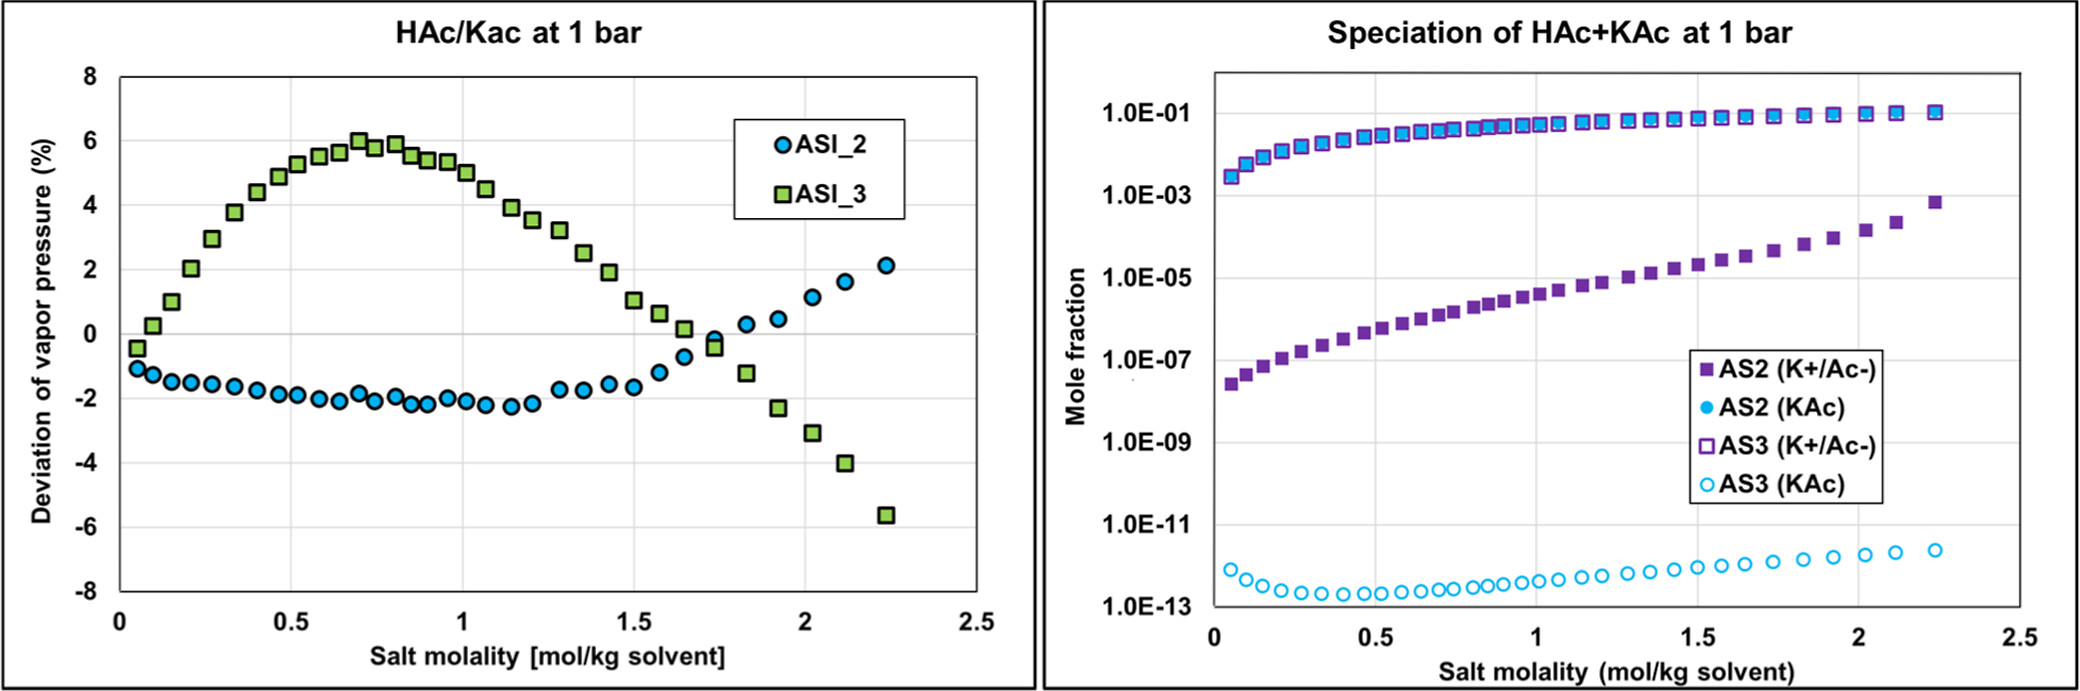
Both ASI_2 and ASI_3 parameter sets are obtained from regression on combined binary and ternary data using the PD assumption. We can notice that both sets provide acceptable results with an objective function (average relative deviation) output value in the same range of about 35–45%. It was difficult to obtain better results because of some infinite dilution data (at very low concentrations of water or acetic acid of less than 1%), leading to high deviations in partial pressures and, consequently, to high objective function values. Figure 19 shows the detailed deviations and speciations for the binary system (HAc/KAc). Simulation results with ASI_2 seem to better fit experimental pressure binary data. From the right-hand part of Figure 19, it is also observed that the ASI_2 PD speciation is dominated by the molecular KAc compound, while ASI_3 results in high ionic concentration in the system. We know that ASI_2 results are more realistic than those of ASI_3, but to the best of our knowledge there is no speciation data to compare our predictions with. Yet, we can notice that deviations resulting from applying the “ND” assumption using the ASI_3 parameters on the binary data are much larger than those obtained with the ASI_2 parameters. Note that the “ND” calculations with both ASI_2 and ASI_3 parameters are performed a posteriori of the regression. This observation should then be used as a guide to determine which set is the most physically consistent.
Figure 18
Figure 18. Performance of different parameter sets on binary (HAc/KAc) and ternary (W/HAc/KAc) experimental data with ND, FD, and PD calculations. It is observed that.
Figure 19
Figure 19. Comparison of the binary acetic acid-potassium acetate bubble pressure (Psat) PD calculations and corresponding speciation with ASI_2 and ASI_3 parameter sets on isobar data (1 bar) from ref (35) with corresponding speciation.
Figure 20
Figure 20. Comparison of the ternary W/HAc/KAc deviations on partial pressures with PD calculations and corresponding speciation with ASI_2 (top) and ASI_3 (bottom) parameter sets on isobaric data (1 bar) from ref (35). The molar ratio of acetic acid to water is 0.01, 0.03, 0.05, 0.07, 0.09, and 0.11.
Water/Methanol/HAc
Figure 21
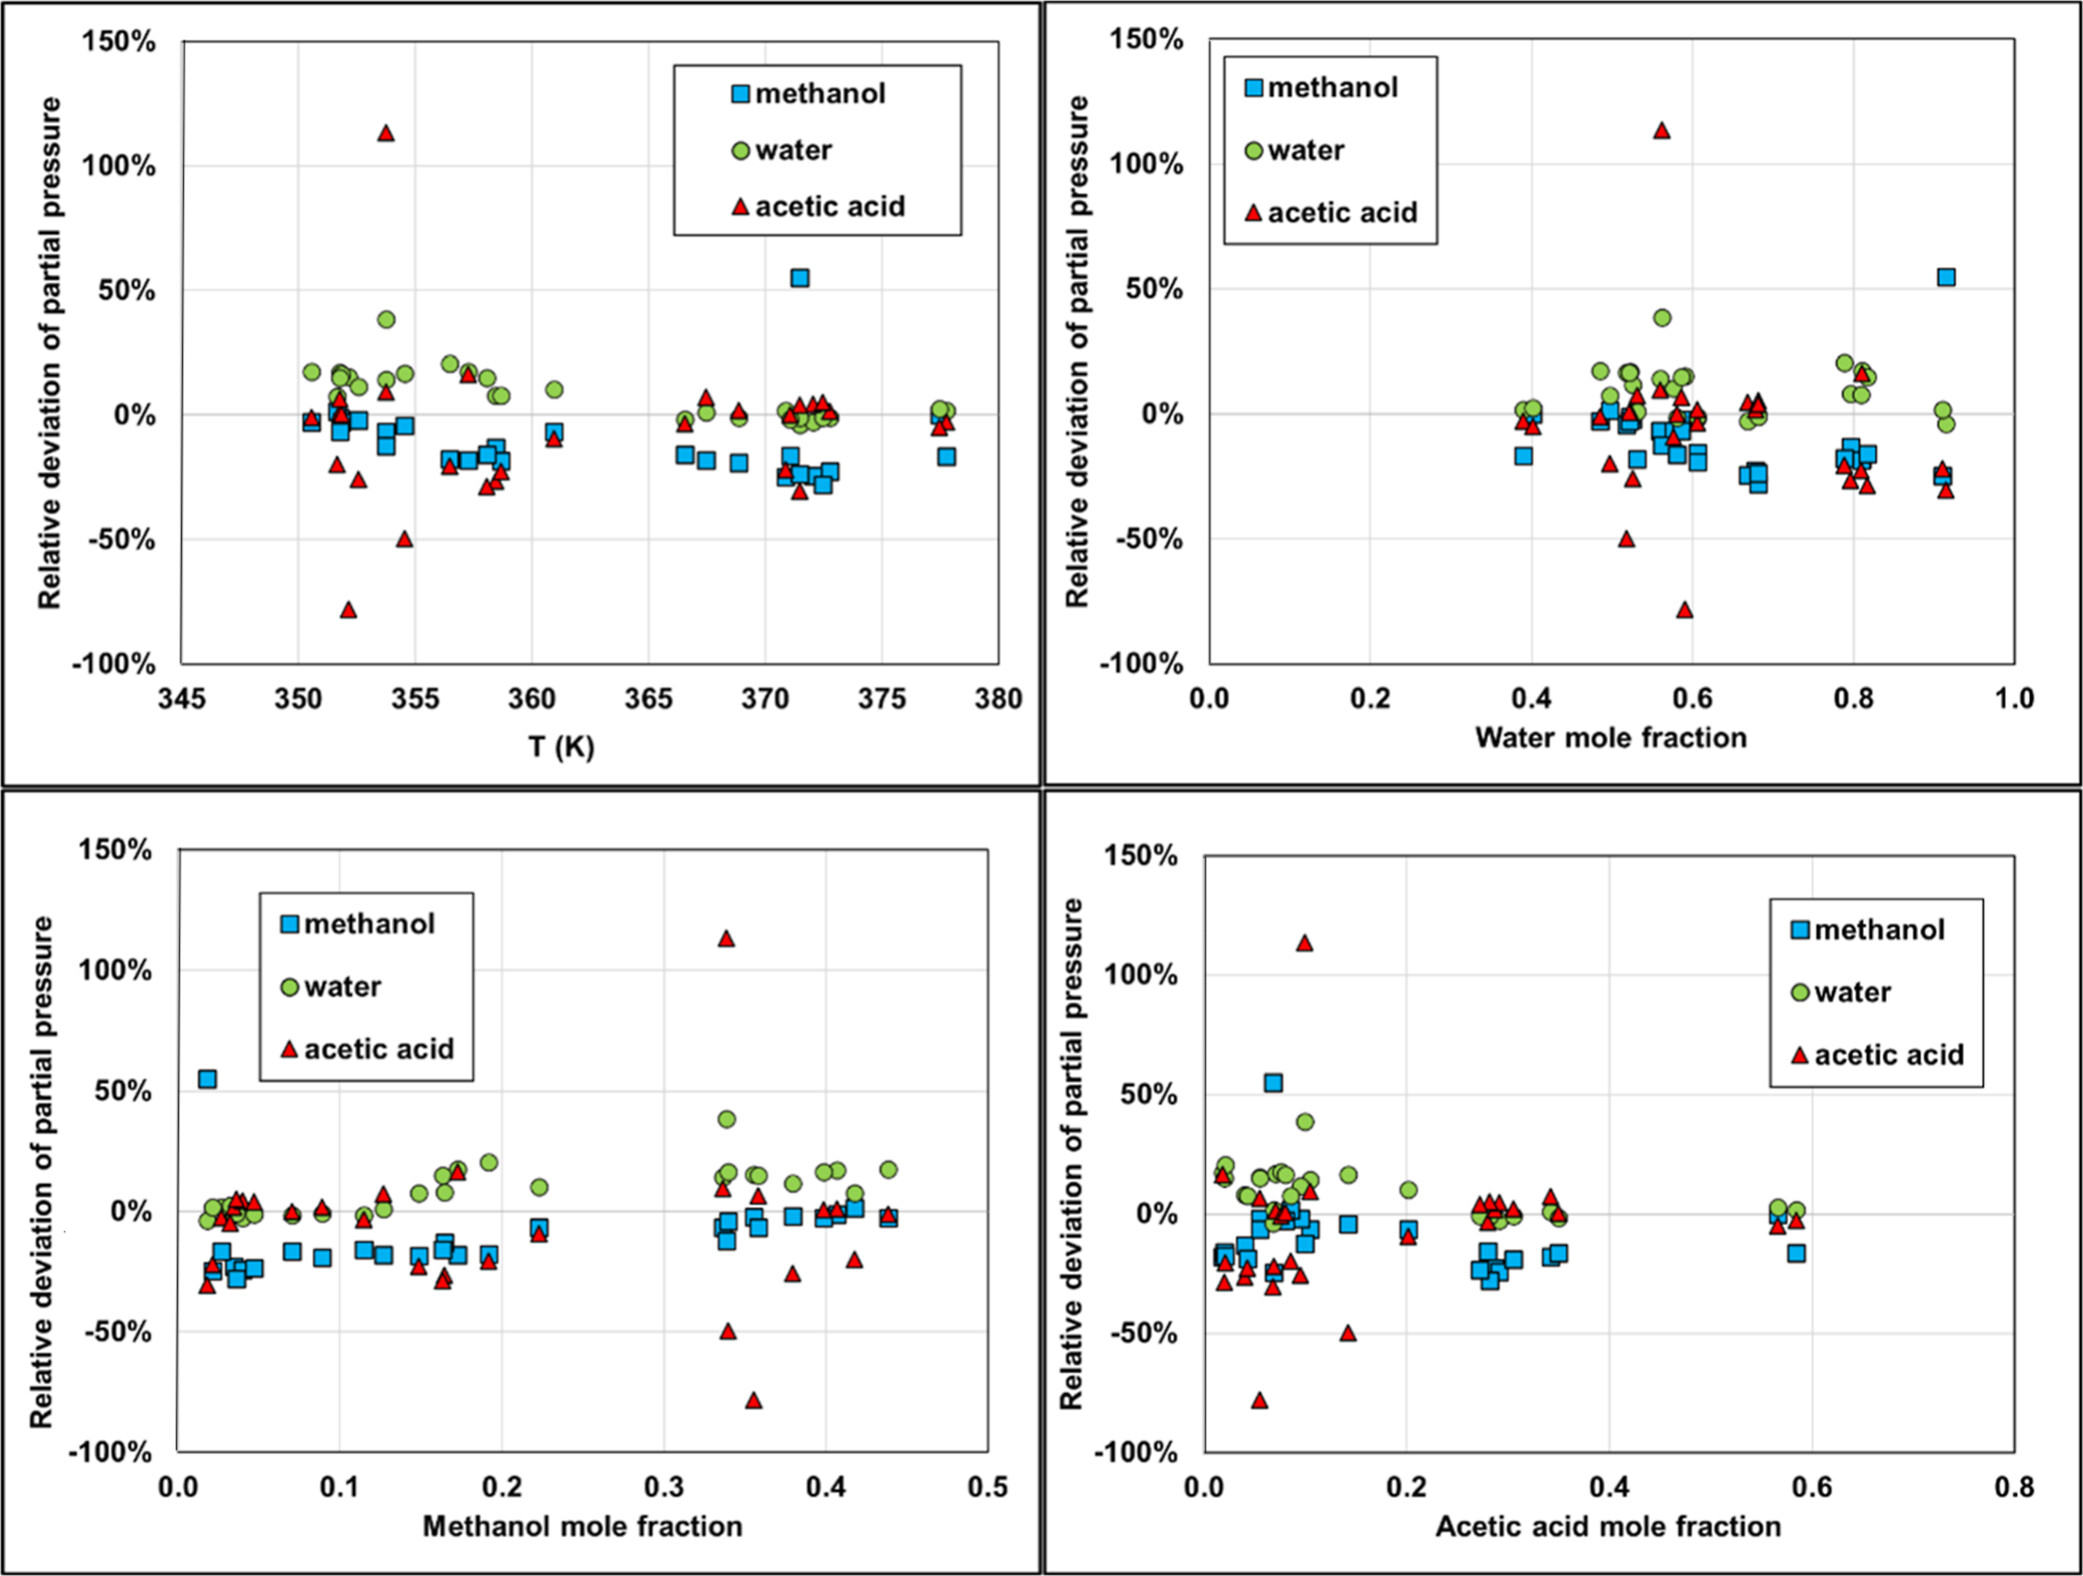
Figure 21. Deviations in partial pressure calculations using Carnot. Isobar data are taken at atmospheric pressure from ref (51) with temperature ranging from 350.55 to 377.75 K.
Conclusions
Supporting Information
The Supporting Information is available free of charge at https://pubs.acs.org/doi/10.1021/acs.jced.5c00412.
Contains the description of the model and all the parameters that have been used in this work (PDF)
Terms & Conditions
Most electronic Supporting Information files are available without a subscription to ACS Web Editions. Such files may be downloaded by article for research use (if there is a public use license linked to the relevant article, that license may permit other uses). Permission may be obtained from ACS for other uses through requests via the RightsLink permission system: http://pubs.acs.org/page/copyright/permissions.html.
Author Information
- Jean-Charles de Hemptinne - IFP Energies Nouvelles, 1 et 4 Avenue de Bois-Préau, 92852 Rueil-Malmaison, Cedex, France;
 https://orcid.org/0000-0003-1607-3960;
- Shu Wang - AspenTech, 20 Crosby Dr, Bedford, Massachusetts 01730, United States;https://orcid.org/0000-0002-7070-5095
- Bjorn Maribo-Mogensen - Hafnium Laboratories, Vestergade 16, Third Fl., 1456 Copenhagen, Denmark;https://orcid.org/0000-0001-5447-412X
- Salvador Asensio-Delgado - Syensqo, 85 Av des Frères Perret, 69190 Saint Fons, France;https://orcid.org/0000-0002-0722-6139
- Stephanie Peper - Bayer, Kaiser Wilhelm-Allee 3, 51373 Leverkusen, Germany;https://orcid.org/0000-0002-9660-1745
- Andrés González de Castilla - Bayer, Kaiser Wilhelm-Allee 3, 51373 Leverkusen, Germany;https://orcid.org/0000-0003-0536-7402
Corresponding Authors: Edouard Moine: review and validation; Shu Wang: review, editing, and validation; Bjorn Maribo-Mogensen: review; Emrah Altuntepe: review and funding; Salvador Asensio-Delgado:: review and funding; Stephanie Peper:: review and funding; Andrés González de Castilla:: review and funding; Pascal Ferrari:: review and funding; Ellen Steimers: review, editing, and funding; and Susanna Kuitunen: review, funding.
Acknowledgments
The authors acknowledge the EleTher Joint Industry Project that has financed the work. The corresponding authors thank the personal input of all industry participants.
References
This article references 87 other publications.
- 1Muzzio, C. R.; Timmermann, E. O. Effect of electrolytes on the temperature profile of saline extractive distillation columns. Lat. Am. Appl. Res. 2014, 44 (1), 41, DOI: 10.52292/j.laar.2014.417Google ScholarThere is no corresponding record for this reference.
- 2Popoola, L. T. Organic green corrosion inhibitors (OGCIs): a critical review. Corros. Rev. 2019, 37 (2), 71– 102, DOI: 10.1515/corrrev-2018-0058Google ScholarThere is no corresponding record for this reference.
- 3Königsberger, E.; Hefter, G.; May, P. M. Solubility and related properties in hydrometallurgy. Pure Appl. Chem. 2009, 81 (9), 1537– 1545, DOI: 10.1351/PAC-CON-09-01-02Google ScholarThere is no corresponding record for this reference.
- 4Ferrando, N.; Lugo, R.; Mougin, P. Coupling activity coefficient models, Henry constant equations and equations of state to calculate vapor-liquid and solid-liquid equilibrium data. Chem. Eng. Process. 2006, 45, 773– 782, DOI: 10.1016/j.cep.2006.03.003Google ScholarThere is no corresponding record for this reference.
- 5Reinsch, T.; Dobson, P.; Asanuma, H.; Huenges, E.; Poletto, F.; Sanjuan, B. Utilizing supercritical geothermal systems: a review of past ventures and ongoing research activities. Geothermal Energy 2017, 5 (1), 16, DOI: 10.1186/s40517-017-0075-yGoogle ScholarThere is no corresponding record for this reference.
- 6Appelo, C. Principles, caveats and improvements in databases for calculating hydrogeochemical reactions in saline waters from 0 to 200°C and 1 to 1000 atm. Appl. Geochem. 2015, 55, 62– 71, DOI: 10.1016/j.apgeochem.2014.11.007Google ScholarThere is no corresponding record for this reference.
- 7Aniya, V.; Singh, A.; De, D.; Satyavathi, B. An energy efficient route for the dehydration of 2-Methylpropan-2-ol: Experimental investigation, modeling and process optimization. Sep. Purif. Technol. 2015, 156, 738– 753, DOI: 10.1016/j.seppur.2015.10.072Google ScholarThere is no corresponding record for this reference.
- 8Lei, S.; Zeng, Z.; Cheng, S.; Xie, J. Fast-charging of lithium-ion batteries: A review of electrolyte design aspects. Battery Energy 2023, 2 (5), 20230018, DOI: 10.1002/bte2.20230018Google ScholarThere is no corresponding record for this reference.
- 9Hendriks, E.; Kontogeorgis, G. M.; Dohrn, R.; de Hemptinne, J. C.; Economou, I. G.; Žilnik, L. F.; Vesovic, V. Industrial Requirements for Thermodynamics and Transport Properties. Ind. Eng. Chem. Res. 2010, 49 (22), 11131– 11141, DOI: 10.1021/ie101231bGoogle ScholarThere is no corresponding record for this reference.
- 10Kontogeorgis, G. M.; Dohrn, R.; Economou, I. G.; de Hemptinneten Kate, J. C. A.; Kuitunen, S.; Mooijer, M.; Žilnik, L. F.; Vesovic, V.; Vesovic, V. Industrial Requirements for Thermodynamic and Transport Properties: 2020. Ind. Eng. Chem. Res. 2021, 60 (13), 4987– 5013, DOI: 10.1021/acs.iecr.0c05356Google ScholarThere is no corresponding record for this reference.
- 11de Hemptinne, J. C.; Kontogeorgis, G. M.; Dohrn, R.; Economou, I. G.; ten Kate, A.; KuitunenFele Žilnik, S. L.; De Angelis, M. G.; Vesovic, V. A View on the Future of Applied Thermodynamics. Ind. Eng. Chem. Res. 2022, 61 (39), 14664– 14680, DOI: 10.1021/acs.iecr.2c01906Google ScholarThere is no corresponding record for this reference.
- 12Kontogeorgis, G. M.; Kate, A.; Hajiw-Riberaud, M.; de Hemptinne, J. C. Conclusions from Round Table Discussion during IUT of ESAT 2021 electrolyte thermodynamics challenges - From industrial needs to academic research. Fluid Phase Equilib. 2022, 556, 113399, DOI: 10.1016/j.fluid.2022.113399Google ScholarThere is no corresponding record for this reference.
- 13Held, C. Thermodynamic gE Models and Equations of State for Electrolytes in a Water-Poor Medium: A Review. J. Chem. Eng. Data 2020, 65 (11), 5073– 5082, DOI: 10.1021/acs.jced.0c00812Google ScholarThere is no corresponding record for this reference.
- 14May, P. M.; Rowland, D. Thermodynamic Modeling of Aqueous Electrolyte Systems:Current Status. J. Chem. Eng. Data 2017, 62 (9), 2481– 2495, DOI: 10.1021/acs.jced.6b01055Google ScholarThere is no corresponding record for this reference.
- 15Held, C.; Sadowski, G. Modeling aqueous electrolyte solutions. Part 2. Weak electrolytes. Fluid Phase Equilib. 2009, 279 (2), 141– 148, DOI: 10.1016/j.fluid.2009.02.015Google ScholarThere is no corresponding record for this reference.
- 16Tsanas, C.; Hemptinne, J.-C. d.; Mougin, P. Calculation of phase and chemical equilibrium for multiple ion-containing phases including stability analysis. Chem. Eng. Sci. 2022, 248, 117174, DOI: 10.1016/j.ces.2021.117174Google ScholarThere is no corresponding record for this reference.
- 17Vaque Aura, S.; Roa Pinto, J.-S.; Ferrando, N.; de Hemptinne, J. C.; ten Kate, A.; Kuitunen, S.; Diamantonis, N.; Gerlach, T.; Heilig, M.; Becker, G.; Brehelin, M. Data Analysis for Electrolyte Systems: A Method Illustrated on Alkali Halides in Water. J. Chem. Eng. Data 2021, 66 (8), 2976– 2990, DOI: 10.1021/acs.jced.1c00105Google ScholarThere is no corresponding record for this reference.
- 18Yang, F.; Ngo, T. D.; Kontogeorgis, G.; de Hemptinne, J. C. A Benchmark Database for Mixed-Solvent Electrolyte Solutions: Consistency Analysis Using E-NRTL. Ind. Eng. Chem. Res. 2022, 61, 15576– 15593, DOI: 10.1021/acs.iecr.2c00059Google ScholarThere is no corresponding record for this reference.
- 19Kiemde, A. F.; Ferrando, N.; Hemptinne, J.-C. d.; Le Gallo, Y.; Reveillère, A.; Roa Pinto, J. S. Hydrogen and air storage in salt caverns: a thermodynamic model for phase equilibrium calculations. Sci. Technol. Energy Transition 2023, 78, 10, DOI: 10.2516/stet/2023004Google ScholarThere is no corresponding record for this reference.
- 20Marcus, Y. Gibbs Energies of Transfer of Anions from Water to Mixed Aqueous Organic Solvents. Chem. Rev. 2007, 107 (9), 3880– 3897, DOI: 10.1021/cr068045rGoogle ScholarThere is no corresponding record for this reference.
- 21Marcus, Y. Ions in Water and Biophysical implications:From Chaos to Cosmos; Springer, 2012.Google ScholarThere is no corresponding record for this reference.
- 22Thomsen, K. Electrolyte Solutions: Thermodynamics, Crystallization, Separation Methods. https://backend.orbit.dtu.dk/ws/portalfiles/portal/131770579/ElectrolyteCompendium.pdf.Google ScholarThere is no corresponding record for this reference.
- 23Kontogeorgis, G. M.; Folas, G. K. Thermodynamic Models for Industrial Applications: From Classical and Advanced Mixing Rules to Association Theories; Wiley, 2010.Google ScholarThere is no corresponding record for this reference.
- 24Dulitskaya, K. A. Vapor Pressure of some Binary Systems. Report I. Zh. Obshch. Khim. 1945, 15 (1–2), 9– 21Google ScholarThere is no corresponding record for this reference.
- 25Yao, J.; Li, H.; Han, S. Vapor-liquid equilibrium data for methanol–water–NaCl at 45°C. Fluid Phase Equilib. 1999, 162 (1–2), 253– 260, DOI: 10.1016/S0378-3812(99)00204-6Google ScholarThere is no corresponding record for this reference.
- 26Wrewsky, M. Über Zusammen Setzung und Spannung des Dampfes binärer Flüssigkeitsgemische. Z. Phys. Chem. 1913, 81U (1), 1– 29, DOI: 10.1515/zpch-1913-8102Google ScholarThere is no corresponding record for this reference.
- 27Bernatová, S.; Aim, K.; Wichterle, I. Isothermal vapour–liquid equilibrium with chemical reaction in the quaternary water+methanol+acetic acid+methyl acetate system, and in five binary subsystems. Fluid Phase Equilib. 2006, 247 (1–2), 96– 101, DOI: 10.1016/j.fluid.2006.06.005Google ScholarThere is no corresponding record for this reference.
- 28Haddad, P. O.; Edmister, W. C. Phase equilibria in acetic acid-diethylketone-water system. J. Chem. Eng. Data 1972, 17 (3), 275– 278, DOI: 10.1021/je60054a035Google ScholarThere is no corresponding record for this reference.
- 29Campbell, A. N.; Kartzmark, E. M.; Gieskes, J. M. T. M. Vapor-liquid equilibria, densities, and refractivities in the system acetic acid – chloroform – water at 25. Can. J. Chem. 1963, 41 (2), 407– 429, DOI: 10.1139/v63-059Google ScholarThere is no corresponding record for this reference.
- 30Horstmann, S.; Pöpken, T.; Gmehling, J. Phase equilibria and excess properties for binary systems in reactive distillation processes. Fluid Phase Equilib. 2001, 180 (1–2), 221– 234, DOI: 10.1016/S0378-3812(01)00347-8Google ScholarThere is no corresponding record for this reference.
- 31Wagner, M.; Apelblat, A.; Tamir, A. Excess Gibbs free energy in methanol + acetic acid and ethanol + acetic acid. J. Chem. Thermodyn. 1980, 12 (2), 181– 186, DOI: 10.1016/0021-9614(80)90128-7Google ScholarThere is no corresponding record for this reference.
- 32Arlt, W. Determination of phase equilibria in reacting mixtures. In 8th International Conference on Properties and Phase Equilibria for Product and Process Design, Noordwijkerhout , 1998, pp 1– 6.Google ScholarThere is no corresponding record for this reference.
- 33Robinson, R. The Activity Coefficients of Alkali Nitrates, Acetates and p-Toluenesulfonates in Aqueous Solution from Vapor Pressure Measurements. J. Am. Chem. Soc. 1935, 57 (7), 1165– 1168, DOI: 10.1021/ja01310a005Google ScholarThere is no corresponding record for this reference.
- 34Hamer, W. J.; Wu, Y.-C. Osmotic Coefficients and Mean Activity Coefficients of Uni-univalent Electrolytes in Water at 25°C. J. Phys. Chem. Ref. Data 1972, 1 (4), 1047– 1099, DOI: 10.1063/1.3253108Google ScholarThere is no corresponding record for this reference.
- 35Vercher, E.; Orchillés, A. V.; Vázquez, M. I.; Martínez-Andreu, A. Isobaric Vapor–Liquid Equilibria for Water + Acetic Acid + Potassium Acetate. J. Chem. Eng. Data 2004, 49 (3), 566– 569, DOI: 10.1021/je034169eGoogle ScholarThere is no corresponding record for this reference.
- 36Li, B.; Luo, Y.; Zhu, Z. Vapor-Liquid Equilibria for Salt-Containing Systems by Equation of State - Measurement and Correlation of Vapor Pressures for Salt Solutions with Single Solvent. Chem. Ind. Eng. 1986, 102– 110Google ScholarThere is no corresponding record for this reference.
- 37Tammann, G. The vapor tensions of solutions. Z. Phys. Chem. 1888, 2 (1), 42– 47Google ScholarThere is no corresponding record for this reference.
- 38Beyer, R. Characterization of binary and ternary electrolyte systems with anions of organic acids: Measurement of the water activity coefficient and thermodynamic modeling. Ph.D. Thesis, 2001.Google ScholarThere is no corresponding record for this reference.
- 39Robinson, R. A.; Stokes, R. H. Tables of osmotic and activity coefficients of electrolytes in aqueous solution at 25° C. Trans. Faraday Soc. 1949, 45 (0), 612– 624, DOI: 10.1039/TF9494500612Google ScholarThere is no corresponding record for this reference.
- 40Noyes, A. A.; MacInnes, D. A. The Ionization And Activity Of Largely Ionized Substances. 1. J. Am. Chem. Soc. 1920, 42 (2), 239– 245, DOI: 10.1021/ja01447a006Google ScholarThere is no corresponding record for this reference.
- 41Harned, H. S.; Cook, M. A. The Thermodynamics of Aqueous Potassium Hydroxide Solutions from Electromotive Force Measurements. J. Am. Chem. Soc. 1937, 59 (3), 496– 500, DOI: 10.1021/ja01282a021Google ScholarThere is no corresponding record for this reference.
- 42Knobel, M. The activities of the ions of potassium hydroxide in aqueous solution. J. Am. Chem. Soc. 1923, 45 (1), 70– 76, DOI: 10.1021/ja01654a010Google ScholarThere is no corresponding record for this reference.
- 43Gerlach, G. T. Boiling temperatures of salt solutions and comparison of the boiling point elevation with other properties of salt solutions. Z. Anal. Chem., 1887(26), 412– 530.Google ScholarThere is no corresponding record for this reference.
- 44Korobkov, V. I.; Galinker, I. S. The equilibrium in systems brine─steam. Zh. Prikl. Khim. 1956, 29, 1479– 1483Google ScholarThere is no corresponding record for this reference.
- 45Dieterici, C. Ueber die Dampfdrucke wässeriger Lösungen bei 0° C. Ann. Phys. 1893, 286 (9), 47– 87, DOI: 10.1002/andp.18932860903Google ScholarThere is no corresponding record for this reference.
- 46Kangro, W.; Groeneveld, A. Konzentrierte wäßrige Lösungen, I. Z. Phys. Chem. 1962, 32 (1_2), 110– 126, DOI: 10.1524/zpch.1962.32.1_2.110Google ScholarThere is no corresponding record for this reference.
- 47Mashovets, V. P.; Penkina, N. V.; Puchkov, L. V.; Kurochkina, V. Saturated vapor pressure over K2O - Al2O3 - H2O system in the range of temperatures 25 - 350 °C. Zh. Prikl. Khim. 1971, 339– 343Google ScholarThere is no corresponding record for this reference.
- 48Polka, H. M. Experimental Determination and Calculation of Vapor-Liquid Equilibria for Systems with Strong Electrolytes. Ph.D. Thesis, 1994.Google ScholarThere is no corresponding record for this reference.
- 49Tomasula, P.; Czerwienski, G. J.; Tassios, D. Vapor pressures and osmotic coefficients: electrolyte solutions of methanol. Fluid Phase Equilib. 1987, 38 (1–2), 129– 153, DOI: 10.1016/0378-3812(87)90008-2Google ScholarThere is no corresponding record for this reference.
- 50Gao, D.; Zhang, H.; Lücking, P.; Sun, H.; Si, J.; Zhu, D.; Chen, H.; Shi, J. Computation of Isobaric Vapor-Liquid Equilibrium Data for Binary and Ternary Mixtures of Methanol, Water, and Ethanoic Acid from T, p, x, and HmE Measurements. J. Thermodyn. 2012, 2012, 1– 13, DOI: 10.1155/2012/641251Google ScholarThere is no corresponding record for this reference.
- 51Sawistowski, H.; Pilavakis, P. A. Vapor-liquid equilibrium with association in both phases. Multicomponent systems containing acetic acid. J. Chem. Eng. Data 1982, 27 (1), 64– 71, DOI: 10.1021/je00027a021Google ScholarThere is no corresponding record for this reference.
- 52Kurzin, A. V.; Evdokimov, A. N.; Maiyorova, H. D.; Maiyorova, H. D. Activity Coefficients of Methanol and Water in the Reaction of Potassium Hydroxide Methanolysis. J. Chem. Eng. Data 2003, 48 (2), 344– 346, DOI: 10.1021/je020141bGoogle ScholarThere is no corresponding record for this reference.
- 53Takakura, K.; Sumoge, I.; Araki, S.; Yamamoto, H. Salt Effects on Vapor Liquid Equilibrium of Acetic Acid-Water System. Netsu Bussei 2015, 28 (4), 166– 172, DOI: 10.2963/jjtp.28.166Google ScholarThere is no corresponding record for this reference.
- 54Fournier, P.; Oelkers, E. H.; Gout, R.; Pokrovski, G. Experimental determination of aqueous sodium-acetate dissociation constants at temperatures from 20 to 240°C. Chem. Geol. 1998, 151 (1), 69– 84, DOI: 10.1016/S0009-2541(98)00071-0Google ScholarThere is no corresponding record for this reference.
- 55Akinfiev, N. Thermodynamic description of alkali metal hydroxides over a wide range of temperatures, pressures and densities of aqueous fluids. E3S Web Conf. 2019, 98, 05001, DOI: 10.1051/e3sconf/20199805001Google ScholarThere is no corresponding record for this reference.
- 56Akinfiev, N. N.; Diamond, L. W. Thermodynamic description of aqueous nonelectrolytes at infinite dilution over a wide range of state parameters. Geochim. Cosmochim. Acta 2003, 67 (4), 613– 629, DOI: 10.1016/S0016-7037(02)01141-9Google ScholarThere is no corresponding record for this reference.
- 57Ho, P. C.; Palmer, D. A.; Wood, R. H. Conductivity Measurements of Dilute Aqueous LiOH, NaOH, and KOH Solutions to High Temperatures and Pressures Using a Flow-Through Cell. J. Phys. Chem. B 2000, 104 (50), 12084– 12089, DOI: 10.1021/jp000845xGoogle ScholarThere is no corresponding record for this reference.
- 58Gimblett, F. G. R.; Monk, C. B. E. . m.f. studies of electrolytic dissociation. Part 7.─Some alkali and alkaline earth metal hydroxides in water. Trans. Faraday Soc. 1954, 50 (0), 965– 972, DOI: 10.1039/TF9545000965Google ScholarThere is no corresponding record for this reference.
- 59Shcherbakov, V. N.; Lukashov, Y. Y.; Lukashov, Y. M. Electrolytical properties of solutions of lithium hydroxide at high temperatures and pressures. Therm. Eng. 2013, 60 (4), 280– 284, DOI: 10.1134/S0040601513040125Google ScholarThere is no corresponding record for this reference.
- 60Corti, H.; Crovetto, R.; Fernndez-Prini, R. Aqueous solutions of lithium hydroxide at various temperatures: Conductivity and activity coefficients. J. Solution Chem. 1979, 8 (12), 897– 908, DOI: 10.1007/BF00644886Google ScholarThere is no corresponding record for this reference.
- 61Read, A. J. Ionization constants of aqueous ammonia from 25 to 250C and to 2000 bar. J. Solution Chem. 1982, 11 (9), 649– 664, DOI: 10.1007/BF00650397Google ScholarThere is no corresponding record for this reference.
- 62Sverjensky, D. A.; Hemley, J. J.; D’angelo, W. M. Thermodynamic assessment of hydrothermal alkali feldspar-mica-aluminosilicate equilibria. Geochim. Cosmochim. Acta 1991, 55 (4), 989– 1004, DOI: 10.1016/0016-7037(91)90157-ZGoogle ScholarThere is no corresponding record for this reference.
- 63Bianchi, H.; Corti, H. R.; Fernndez-Prini, R. Electrical conductivity of aqueous sodium hydroxide solutions at high temperatures. J. Solution Chem. 1994, 23 (11), 1203– 1212, DOI: 10.1007/BF00974030Google ScholarThere is no corresponding record for this reference.
- 64Benezeth, P.; Castet, S.; Dandurand, J.-L.; Gout, R.; Schott, J. Experimental study of aluminum-acetate complexing between 60 and 200°c. Geochim. Cosmochim. Acta 1994, 58 (21), 4561– 4571, DOI: 10.1016/0016-7037(94)90191-0Google ScholarThere is no corresponding record for this reference.
- 65Shock, E. L.; Koretsky, C. M. Metal-organic complexes in geochemical processes: Calculation of standard partial molal thermodynamic properties of aqueous acetate complexes at high pressures and temperatures. Geochim. Cosmochim. Acta 1993, 57 (20), 4899– 4922, DOI: 10.1016/0016-7037(93)90128-jGoogle ScholarThere is no corresponding record for this reference.
- 66Fournier, P.; Gout, R.; Oelkers, E. H. A Raman Spectrographic and Potentiometric Study of Aqueous Lithium and Potassium Acetate Complexation at Temperatures from 20 to 200 ◦C. J. Solution Chem. 2005, 34 (8), 881– 898, DOI: 10.1007/s10953-005-6251-xGoogle ScholarThere is no corresponding record for this reference.
- 67Daniele, P. G.; De Robertis, A.; De Stefano, C.; Sammartano, S.; Rigano, C. On the possibility of determining the thermodynamic parameters for the formation of weak complexes using a simple model for the dependence on ionic strength of activity coefficients: Na+, K+, and Ca2+ complexes of low molecular weight ligands in aqueous solution. J. Chem. Soc., Dalton Trans. 1985, 11, 2353, DOI: 10.1039/DT9850002353Google ScholarThere is no corresponding record for this reference.
- 68Archer, D. W.; Monk, C. B. 594 Ion-association constants of some acetates by pH (glass electrode) measurements. J. Chem. Soc. 1964, 3117, DOI: 10.1039/jr9640003117Google ScholarThere is no corresponding record for this reference.
- 69Zimmerman, G. H.; Wood, R. H. Conductance of Dilute Sodium Acetate Solutions to 469 K and of Acetic Acid and Sodium Acetate/Acetic Acid Mixtures to 548 K and 20 MPa. J. Solution Chem. 2002, 31 (12), 995– 1017, DOI: 10.1023/A:1021829610606Google ScholarThere is no corresponding record for this reference.
- 70Oscarson, J. L.; Gillespie, S. E.; Christensen, J. J.; Izatt, R. M.; Brown, P. R. Thermodynamic quantities for the interaction of H+ and Na+ with C2H3O 2 ? and Cl? in aqueous solution from 275 to 320C. J. Solution Chem. 1988, 17 (9), 865– 885, DOI: 10.1007/BF00646554Google ScholarThere is no corresponding record for this reference.
- 71Hemptinne, J.-C. d.; Ferrando, N.; Hajiw-Riberaud, M.; Lachet, V.; Maghsoodloo, S.; Mougin, P.; Ngo, T. D.; Pigeon, L.; Romero Yanes, J.; Wender, A. Carnot: a thermodynamic library for energy industries. Sci. Technol. Energy Transition 2023, 78, 30, DOI: 10.2516/stet/2023023Google ScholarThere is no corresponding record for this reference.
- 72Chen, C. C.; Evans, L. B. A local composition model for the excess Gibbs energy of aqueous electrolyte systems. AIChE J. 1986, 32 (3), 444– 454, DOI: 10.1002/aic.690320311Google ScholarThere is no corresponding record for this reference.
- 73Chen, C.-C.; britt, H. I.; Boston, J. F.; Evans, L. B. Local composition model for excess Gibbs energy of electrolyte systems. Part I: Single solvent, single completely dissociated electrolyte systems. AIChE J. 1982, 28 (4), 588– 596, DOI: 10.1002/aic.690280410Google ScholarThere is no corresponding record for this reference.
- 74Kontogeorgis, G. M.; Voutsas, E. C.; Yakoumis, I. V.; Tassios, D. P. An equation of state for associating fluids. Ind. Eng. Chem. Res. 1996, 35 (11), 4310– 4318, DOI: 10.1021/ie9600203Google ScholarThere is no corresponding record for this reference.
- 75Hayden, J. G.; O’Connell, J. P. Generalized method for predicting second virial coefficients. Ind. Eng. Chem. Process Des. Dev.c 1975, 14 (3), 209– 216, DOI: 10.1021/i260055a003Google ScholarThere is no corresponding record for this reference.
- 76Wang, S.; Song, Y.; Zhang, Y.; Chen, C.-C. Electrolyte Thermodynamic Models in Aspen Process Simulators and Their Applications. Ind. Eng. Chem. Res. 2022, 61 (42), 15649– 15660, DOI: 10.1021/acs.iecr.2c01881Google ScholarThere is no corresponding record for this reference.
- 77Arcis, H.; Bachet, M.; Dickinson, S.; Duncanson, I.; Eaker, R. W.; Jarvis, J.; Johnson, K.; Lee, C. A.; Lord, F.; Marks, C.; Tremaine, P. R. Revised Parameters for the IAPWS Formulation for the Ionization Constant of Water Over a Wide Range of Temperatures and Densities, Including Near-Critical Conditions. J. Phys. Chem. Ref. Data 2024, 53 (2), 23103, DOI: 10.1063/5.0198792Google ScholarThere is no corresponding record for this reference.
- 78Tanger, J. C.; Helgeson, H. C. Calculation of the thermodynamic and transport properties of aqueous species at high pressures and temperatures; revised equations of state for the standard partial molal properties of ions and electrolytes. Am. J. Sci. 1988, 288 (1), 19– 98, DOI: 10.2475/ajs.288.1.19Google ScholarThere is no corresponding record for this reference.
- 79Fisher, J. R.; Barnes, H. L. Ion-product constant of water to 350 °C. J. Phys. Chem. 1972, 76 (1), 90– 99, DOI: 10.1021/j100645a016Google ScholarThere is no corresponding record for this reference.
- 80Robinson, R. A.; Stokes, R. H. Electrolyte Solutions, 2nd ed.; Dover Publications, 2002.Google ScholarThere is no corresponding record for this reference.
- 81Gold, V. The IUPAC Compendium of Chemical Terminology; International Union of Pure and Applied Chemistry (IUPAC), 2019.Google ScholarThere is no corresponding record for this reference.
- 82Kosinski, J. J.; Wang, P.; Springer, R. D.; Anderko, A. Modeling acid–base equilibria and phase behavior in mixed-solvent electrolyte systems. Fluid Phase Equilib. 2007, 256 (1), 34– 41, DOI: 10.1016/j.fluid.2006.11.018Google ScholarThere is no corresponding record for this reference.
- 83Advanced Tools for Optimization and Uncertainty Treatment (ATOUT), 1 User Manual , 2019.Google ScholarThere is no corresponding record for this reference.
- 84Hansen, N.; Ostermeier, A. Completely derandomized self-adaptation in evolution strategies. Evol. Comput. 2001, 9 (2), 159– 195, DOI: 10.1162/106365601750190398Google ScholarThere is no corresponding record for this reference.
- 85Hansen, N. The CMA Evolution Strategy: A Tutorial. https://arxiv.org/pdf/1604.00772.Google ScholarThere is no corresponding record for this reference.
- 86Langouët, H. Optimisation sans dérivées sous contraintes: deux applications industrielles en ingénierie de réservoir et en calibration des moteurs; Thèse de doctorat, Université de Nice-Sophia Antipolis, 2011.Google ScholarThere is no corresponding record for this reference.
- 87Valverde, J. L.; Ferro, V. R.; Giroir-Fendler, A. Estimation of e-NRTL binary interaction parameters and its impact on the prediction of thermodynamic properties of multicomponent electrolyte systems. Fluid Phase Equilib. 2022, 551, 113264, DOI: 10.1016/j.fluid.2021.113264Google ScholarThere is no corresponding record for this reference.
Cited By
This article has not yet been cited by other publications.
Article Views
Altmetric
Citations
Article Views are the COUNTER-compliant sum of full text article downloads since November 2008 (both PDF and HTML) across all institutions and individuals. These metrics are regularly updated to reflect usage leading up to the last few days.
Citations are the number of other articles citing this article, calculated by Crossref and updated daily. Find more information about Crossref citation counts.
The Altmetric Attention Score is a quantitative measure of the attention that a research article has received online. Clicking on the donut icon will load a page at altmetric.com with additional details about the score and the social media presence for the given article. Find more information on the Altmetric Attention Score and how the score is calculated.
Recommended Articles
Abstract
Figure 1

Figure 1. Schematic representation of the selected quaternary system, which turns out to be a nine-component system due to the reactive equilibria. HA and BOH stand for acid and base, respectively.
Figure 2

Figure 2. Three types of activity coefficients for a ternary system containing water, a cosolvent, and a salt: (i) blue, solvent activity coefficients; (ii) red, transfer activity coefficient of the ions between pure water and mixed solvent; (iii) green, conventional ionic activity coefficient. The orientation of the arrows shows the type of derivative of the Gibbs energy that they correspond to. SLE stands for solid–liquid equilibrium. The definitions of the variables can be found in the text.
Figure 3
Figure 4
Figure 4. Molality-based dissociation constants of (a) lithium, (b) sodium, and (c) potassium hydroxides as a function of the inverse of the temperature. (55−65) The (d) diagram provided a comparison of (a–c) using Akinfiev-calculated data.
Figure 5

Figure 5. Dissociation constants of acetate salts containing (a) lithium, (b) sodium, and (c) potassium as a function of the inverse of temperature. (54,64−70) The diagram labeled (d) provides a comparison of (a–c) data.
Figure 6
Figure 6. Comparison of fugacity coefficient of acetic acid in the vapor phase as predicted by HOC and CPA equations of state.
Figure 7

Figure 7. Dissociation constant as a function of temperature using eq 7, together with experimental data from ref (78) for H2O, from ref (79) for HAc, from refs (66,and67) for KAc, and from ref (57) for KOH.
Figure 8
Figure 8. Example of response surfaces for the methanol─KAc parameter regression. The points indicate the location of different default parameter sets: [τmi, τim] = [10, −2] (blue dot), [τmi, τim] = [8, −4] (brown dot), and [τmi, τim] = [0, 0] (green dot).
Figure 9
Figure 9. Mean activity coefficient (a) and vapor pressure (b) of Water/KAc mixtures at 25 °C with the default Aspen Plus parameters using Carnot. Calculation of MIAC with ND option is impossible because it requires having ions in the system. Corresponding speciations for MIAC (c) and vapor pressure (d) calculations using the PD approach. MIAC Data are extracted from ref (34) and vapor pressure data from ref (38).
Figure 10
Figure 10. Mean activity coefficient (a) and vapor pressure (b) of Water/KAc mixtures at 25 °C and deviations on MIAC (c) and vapor pressure (d). Experimental data (34,36,38) and modeling results with regressed parameters.
Figure 11
Figure 11. KOH mean activity coefficient (a) and vapor pressure (b) with different methods and parameters (experimental data are from ref (34)). Reg stands for regressed. Speciation of Psat PD calculations as a function of salt molality using default (c) and regressed (d) parameters.
Figure 12
Figure 12. Vapor pressures of the water + KOH system with regressed parameters. The data are from refs (46,and47).
Figure 13
Figure 13. VLE calculation versus experimental data from refs (49and50) (a) Comparison of the methanol-potassium acetate vapor pressure (isotherm data) using the fully dissociated (FD) approach, partially dissociated (PD), or nondissociated (ND) assumptions with Aspen Plus NRTL parameters for both water/ion pair and methanol/ion pair interactions using MSI_0 set; (b) liquid speciation with PD calculation using MSI_0 set; (c) vapor pressure deviation on isobar data (1 bar) using MSI_0 and MSI_1 sets.
Figure 14

Figure 14. Performance of different parameter sets on binary (MeOH/KAc) and ternary (W/MeOH/KAc) experimental data with ND, FD, and PD calculations. Bin and Ter stand for binary and ternary, respectively.
Figure 15
Figure 15. Comparison of the ternary W/MeOH/KAc performance on partial pressures calculations and corresponding speciation with MSI_2 (top) and MSI_3 (bottom) parameter sets at 1, 2, 4, and 6 M potassium acetate. Data are extracted from ref (48).
Figure 16

Figure 16. pH of 9% KAc in water–methanol mixed solvent at 298.15 K computed with MSI_2 and MSI_3 parameter sets.
Figure 17
Figure 17. Comparison of the HAc/KAc bubble temperature at 1 bar, using two options: fully dissociated KAc or molecular KAc with eNRTL using ASI_0 parameter sets. Experimental data were extracted from ref (35).
Figure 18

Figure 18. Performance of different parameter sets on binary (HAc/KAc) and ternary (W/HAc/KAc) experimental data with ND, FD, and PD calculations. It is observed that.
Figure 19
Figure 19. Comparison of the binary acetic acid-potassium acetate bubble pressure (Psat) PD calculations and corresponding speciation with ASI_2 and ASI_3 parameter sets on isobar data (1 bar) from ref (35) with corresponding speciation.
Figure 20
Figure 20. Comparison of the ternary W/HAc/KAc deviations on partial pressures with PD calculations and corresponding speciation with ASI_2 (top) and ASI_3 (bottom) parameter sets on isobaric data (1 bar) from ref (35). The molar ratio of acetic acid to water is 0.01, 0.03, 0.05, 0.07, 0.09, and 0.11.
Figure 21
Figure 21. Deviations in partial pressure calculations using Carnot. Isobar data are taken at atmospheric pressure from ref (51) with temperature ranging from 350.55 to 377.75 K.
References
This article references 87 other publications.
- 1Muzzio, C. R.; Timmermann, E. O. Effect of electrolytes on the temperature profile of saline extractive distillation columns. Lat. Am. Appl. Res. 2014, 44 (1), 41, DOI: 10.52292/j.laar.2014.417There is no corresponding record for this reference.
- 2Popoola, L. T. Organic green corrosion inhibitors (OGCIs): a critical review. Corros. Rev. 2019, 37 (2), 71– 102, DOI: 10.1515/corrrev-2018-0058There is no corresponding record for this reference.
- 3Königsberger, E.; Hefter, G.; May, P. M. Solubility and related properties in hydrometallurgy. Pure Appl. Chem. 2009, 81 (9), 1537– 1545, DOI: 10.1351/PAC-CON-09-01-02There is no corresponding record for this reference.
- 4Ferrando, N.; Lugo, R.; Mougin, P. Coupling activity coefficient models, Henry constant equations and equations of state to calculate vapor-liquid and solid-liquid equilibrium data. Chem. Eng. Process. 2006, 45, 773– 782, DOI: 10.1016/j.cep.2006.03.003There is no corresponding record for this reference.
- 5Reinsch, T.; Dobson, P.; Asanuma, H.; Huenges, E.; Poletto, F.; Sanjuan, B. Utilizing supercritical geothermal systems: a review of past ventures and ongoing research activities. Geothermal Energy 2017, 5 (1), 16, DOI: 10.1186/s40517-017-0075-yThere is no corresponding record for this reference.
- 6Appelo, C. Principles, caveats and improvements in databases for calculating hydrogeochemical reactions in saline waters from 0 to 200°C and 1 to 1000 atm. Appl. Geochem. 2015, 55, 62– 71, DOI: 10.1016/j.apgeochem.2014.11.007There is no corresponding record for this reference.
- 7Aniya, V.; Singh, A.; De, D.; Satyavathi, B. An energy efficient route for the dehydration of 2-Methylpropan-2-ol: Experimental investigation, modeling and process optimization. Sep. Purif. Technol. 2015, 156, 738– 753, DOI: 10.1016/j.seppur.2015.10.072There is no corresponding record for this reference.
- 8Lei, S.; Zeng, Z.; Cheng, S.; Xie, J. Fast-charging of lithium-ion batteries: A review of electrolyte design aspects. Battery Energy 2023, 2 (5), 20230018, DOI: 10.1002/bte2.20230018There is no corresponding record for this reference.
- 9Hendriks, E.; Kontogeorgis, G. M.; Dohrn, R.; de Hemptinne, J. C.; Economou, I. G.; Žilnik, L. F.; Vesovic, V. Industrial Requirements for Thermodynamics and Transport Properties. Ind. Eng. Chem. Res. 2010, 49 (22), 11131– 11141, DOI: 10.1021/ie101231bThere is no corresponding record for this reference.
- 10Kontogeorgis, G. M.; Dohrn, R.; Economou, I. G.; de Hemptinneten Kate, J. C. A.; Kuitunen, S.; Mooijer, M.; Žilnik, L. F.; Vesovic, V.; Vesovic, V. Industrial Requirements for Thermodynamic and Transport Properties: 2020. Ind. Eng. Chem. Res. 2021, 60 (13), 4987– 5013, DOI: 10.1021/acs.iecr.0c05356There is no corresponding record for this reference.
- 11de Hemptinne, J. C.; Kontogeorgis, G. M.; Dohrn, R.; Economou, I. G.; ten Kate, A.; KuitunenFele Žilnik, S. L.; De Angelis, M. G.; Vesovic, V. A View on the Future of Applied Thermodynamics. Ind. Eng. Chem. Res. 2022, 61 (39), 14664– 14680, DOI: 10.1021/acs.iecr.2c01906There is no corresponding record for this reference.
- 12Kontogeorgis, G. M.; Kate, A.; Hajiw-Riberaud, M.; de Hemptinne, J. C. Conclusions from Round Table Discussion during IUT of ESAT 2021 electrolyte thermodynamics challenges - From industrial needs to academic research. Fluid Phase Equilib. 2022, 556, 113399, DOI: 10.1016/j.fluid.2022.113399There is no corresponding record for this reference.
- 13Held, C. Thermodynamic gE Models and Equations of State for Electrolytes in a Water-Poor Medium: A Review. J. Chem. Eng. Data 2020, 65 (11), 5073– 5082, DOI: 10.1021/acs.jced.0c00812There is no corresponding record for this reference.
- 14May, P. M.; Rowland, D. Thermodynamic Modeling of Aqueous Electrolyte Systems:Current Status. J. Chem. Eng. Data 2017, 62 (9), 2481– 2495, DOI: 10.1021/acs.jced.6b01055There is no corresponding record for this reference.
- 15Held, C.; Sadowski, G. Modeling aqueous electrolyte solutions. Part 2. Weak electrolytes. Fluid Phase Equilib. 2009, 279 (2), 141– 148, DOI: 10.1016/j.fluid.2009.02.015There is no corresponding record for this reference.
- 16Tsanas, C.; Hemptinne, J.-C. d.; Mougin, P. Calculation of phase and chemical equilibrium for multiple ion-containing phases including stability analysis. Chem. Eng. Sci. 2022, 248, 117174, DOI: 10.1016/j.ces.2021.117174There is no corresponding record for this reference.
- 17Vaque Aura, S.; Roa Pinto, J.-S.; Ferrando, N.; de Hemptinne, J. C.; ten Kate, A.; Kuitunen, S.; Diamantonis, N.; Gerlach, T.; Heilig, M.; Becker, G.; Brehelin, M. Data Analysis for Electrolyte Systems: A Method Illustrated on Alkali Halides in Water. J. Chem. Eng. Data 2021, 66 (8), 2976– 2990, DOI: 10.1021/acs.jced.1c00105There is no corresponding record for this reference.
- 18Yang, F.; Ngo, T. D.; Kontogeorgis, G.; de Hemptinne, J. C. A Benchmark Database for Mixed-Solvent Electrolyte Solutions: Consistency Analysis Using E-NRTL. Ind. Eng. Chem. Res. 2022, 61, 15576– 15593, DOI: 10.1021/acs.iecr.2c00059There is no corresponding record for this reference.
- 19Kiemde, A. F.; Ferrando, N.; Hemptinne, J.-C. d.; Le Gallo, Y.; Reveillère, A.; Roa Pinto, J. S. Hydrogen and air storage in salt caverns: a thermodynamic model for phase equilibrium calculations. Sci. Technol. Energy Transition 2023, 78, 10, DOI: 10.2516/stet/2023004There is no corresponding record for this reference.
- 20Marcus, Y. Gibbs Energies of Transfer of Anions from Water to Mixed Aqueous Organic Solvents. Chem. Rev. 2007, 107 (9), 3880– 3897, DOI: 10.1021/cr068045rThere is no corresponding record for this reference.
- 21Marcus, Y. Ions in Water and Biophysical implications:From Chaos to Cosmos; Springer, 2012.There is no corresponding record for this reference.
- 22Thomsen, K. Electrolyte Solutions: Thermodynamics, Crystallization, Separation Methods. https://backend.orbit.dtu.dk/ws/portalfiles/portal/131770579/ElectrolyteCompendium.pdf.There is no corresponding record for this reference.
- 23Kontogeorgis, G. M.; Folas, G. K. Thermodynamic Models for Industrial Applications: From Classical and Advanced Mixing Rules to Association Theories; Wiley, 2010.There is no corresponding record for this reference.
- 24Dulitskaya, K. A. Vapor Pressure of some Binary Systems. Report I. Zh. Obshch. Khim. 1945, 15 (1–2), 9– 21There is no corresponding record for this reference.
- 25Yao, J.; Li, H.; Han, S. Vapor-liquid equilibrium data for methanol–water–NaCl at 45°C. Fluid Phase Equilib. 1999, 162 (1–2), 253– 260, DOI: 10.1016/S0378-3812(99)00204-6There is no corresponding record for this reference.
- 26Wrewsky, M. Über Zusammen Setzung und Spannung des Dampfes binärer Flüssigkeitsgemische. Z. Phys. Chem. 1913, 81U (1), 1– 29, DOI: 10.1515/zpch-1913-8102There is no corresponding record for this reference.
- 27Bernatová, S.; Aim, K.; Wichterle, I. Isothermal vapour–liquid equilibrium with chemical reaction in the quaternary water+methanol+acetic acid+methyl acetate system, and in five binary subsystems. Fluid Phase Equilib. 2006, 247 (1–2), 96– 101, DOI: 10.1016/j.fluid.2006.06.005There is no corresponding record for this reference.
- 28Haddad, P. O.; Edmister, W. C. Phase equilibria in acetic acid-diethylketone-water system. J. Chem. Eng. Data 1972, 17 (3), 275– 278, DOI: 10.1021/je60054a035There is no corresponding record for this reference.
- 29Campbell, A. N.; Kartzmark, E. M.; Gieskes, J. M. T. M. Vapor-liquid equilibria, densities, and refractivities in the system acetic acid – chloroform – water at 25. Can. J. Chem. 1963, 41 (2), 407– 429, DOI: 10.1139/v63-059There is no corresponding record for this reference.
- 30Horstmann, S.; Pöpken, T.; Gmehling, J. Phase equilibria and excess properties for binary systems in reactive distillation processes. Fluid Phase Equilib. 2001, 180 (1–2), 221– 234, DOI: 10.1016/S0378-3812(01)00347-8There is no corresponding record for this reference.
- 31Wagner, M.; Apelblat, A.; Tamir, A. Excess Gibbs free energy in methanol + acetic acid and ethanol + acetic acid. J. Chem. Thermodyn. 1980, 12 (2), 181– 186, DOI: 10.1016/0021-9614(80)90128-7There is no corresponding record for this reference.
- 32Arlt, W. Determination of phase equilibria in reacting mixtures. In 8th International Conference on Properties and Phase Equilibria for Product and Process Design, Noordwijkerhout , 1998, pp 1– 6.There is no corresponding record for this reference.
- 33Robinson, R. The Activity Coefficients of Alkali Nitrates, Acetates and p-Toluenesulfonates in Aqueous Solution from Vapor Pressure Measurements. J. Am. Chem. Soc. 1935, 57 (7), 1165– 1168, DOI: 10.1021/ja01310a005There is no corresponding record for this reference.
- 34Hamer, W. J.; Wu, Y.-C. Osmotic Coefficients and Mean Activity Coefficients of Uni-univalent Electrolytes in Water at 25°C. J. Phys. Chem. Ref. Data 1972, 1 (4), 1047– 1099, DOI: 10.1063/1.3253108There is no corresponding record for this reference.
- 35Vercher, E.; Orchillés, A. V.; Vázquez, M. I.; Martínez-Andreu, A. Isobaric Vapor–Liquid Equilibria for Water + Acetic Acid + Potassium Acetate. J. Chem. Eng. Data 2004, 49 (3), 566– 569, DOI: 10.1021/je034169eThere is no corresponding record for this reference.
- 36Li, B.; Luo, Y.; Zhu, Z. Vapor-Liquid Equilibria for Salt-Containing Systems by Equation of State - Measurement and Correlation of Vapor Pressures for Salt Solutions with Single Solvent. Chem. Ind. Eng. 1986, 102– 110There is no corresponding record for this reference.
- 37Tammann, G. The vapor tensions of solutions. Z. Phys. Chem. 1888, 2 (1), 42– 47There is no corresponding record for this reference.
- 38Beyer, R. Characterization of binary and ternary electrolyte systems with anions of organic acids: Measurement of the water activity coefficient and thermodynamic modeling. Ph.D. Thesis, 2001.There is no corresponding record for this reference.
- 39Robinson, R. A.; Stokes, R. H. Tables of osmotic and activity coefficients of electrolytes in aqueous solution at 25° C. Trans. Faraday Soc. 1949, 45 (0), 612– 624, DOI: 10.1039/TF9494500612There is no corresponding record for this reference.
- 40Noyes, A. A.; MacInnes, D. A. The Ionization And Activity Of Largely Ionized Substances. 1. J. Am. Chem. Soc. 1920, 42 (2), 239– 245, DOI: 10.1021/ja01447a006There is no corresponding record for this reference.
- 41Harned, H. S.; Cook, M. A. The Thermodynamics of Aqueous Potassium Hydroxide Solutions from Electromotive Force Measurements. J. Am. Chem. Soc. 1937, 59 (3), 496– 500, DOI: 10.1021/ja01282a021There is no corresponding record for this reference.
- 42Knobel, M. The activities of the ions of potassium hydroxide in aqueous solution. J. Am. Chem. Soc. 1923, 45 (1), 70– 76, DOI: 10.1021/ja01654a010There is no corresponding record for this reference.
- 43Gerlach, G. T. Boiling temperatures of salt solutions and comparison of the boiling point elevation with other properties of salt solutions. Z. Anal. Chem., 1887(26), 412– 530.There is no corresponding record for this reference.
- 44Korobkov, V. I.; Galinker, I. S. The equilibrium in systems brine─steam. Zh. Prikl. Khim. 1956, 29, 1479– 1483There is no corresponding record for this reference.
- 45Dieterici, C. Ueber die Dampfdrucke wässeriger Lösungen bei 0° C. Ann. Phys. 1893, 286 (9), 47– 87, DOI: 10.1002/andp.18932860903There is no corresponding record for this reference.
- 46Kangro, W.; Groeneveld, A. Konzentrierte wäßrige Lösungen, I. Z. Phys. Chem. 1962, 32 (1_2), 110– 126, DOI: 10.1524/zpch.1962.32.1_2.110There is no corresponding record for this reference.
- 47Mashovets, V. P.; Penkina, N. V.; Puchkov, L. V.; Kurochkina, V. Saturated vapor pressure over K2O - Al2O3 - H2O system in the range of temperatures 25 - 350 °C. Zh. Prikl. Khim. 1971, 339– 343There is no corresponding record for this reference.
- 48Polka, H. M. Experimental Determination and Calculation of Vapor-Liquid Equilibria for Systems with Strong Electrolytes. Ph.D. Thesis, 1994.There is no corresponding record for this reference.
- 49Tomasula, P.; Czerwienski, G. J.; Tassios, D. Vapor pressures and osmotic coefficients: electrolyte solutions of methanol. Fluid Phase Equilib. 1987, 38 (1–2), 129– 153, DOI: 10.1016/0378-3812(87)90008-2There is no corresponding record for this reference.
- 50Gao, D.; Zhang, H.; Lücking, P.; Sun, H.; Si, J.; Zhu, D.; Chen, H.; Shi, J. Computation of Isobaric Vapor-Liquid Equilibrium Data for Binary and Ternary Mixtures of Methanol, Water, and Ethanoic Acid from T, p, x, and HmE Measurements. J. Thermodyn. 2012, 2012, 1– 13, DOI: 10.1155/2012/641251There is no corresponding record for this reference.
- 51Sawistowski, H.; Pilavakis, P. A. Vapor-liquid equilibrium with association in both phases. Multicomponent systems containing acetic acid. J. Chem. Eng. Data 1982, 27 (1), 64– 71, DOI: 10.1021/je00027a021There is no corresponding record for this reference.
- 52Kurzin, A. V.; Evdokimov, A. N.; Maiyorova, H. D.; Maiyorova, H. D. Activity Coefficients of Methanol and Water in the Reaction of Potassium Hydroxide Methanolysis. J. Chem. Eng. Data 2003, 48 (2), 344– 346, DOI: 10.1021/je020141bThere is no corresponding record for this reference.
- 53Takakura, K.; Sumoge, I.; Araki, S.; Yamamoto, H. Salt Effects on Vapor Liquid Equilibrium of Acetic Acid-Water System. Netsu Bussei 2015, 28 (4), 166– 172, DOI: 10.2963/jjtp.28.166There is no corresponding record for this reference.
- 54Fournier, P.; Oelkers, E. H.; Gout, R.; Pokrovski, G. Experimental determination of aqueous sodium-acetate dissociation constants at temperatures from 20 to 240°C. Chem. Geol. 1998, 151 (1), 69– 84, DOI: 10.1016/S0009-2541(98)00071-0There is no corresponding record for this reference.
- 55Akinfiev, N. Thermodynamic description of alkali metal hydroxides over a wide range of temperatures, pressures and densities of aqueous fluids. E3S Web Conf. 2019, 98, 05001, DOI: 10.1051/e3sconf/20199805001There is no corresponding record for this reference.
- 56Akinfiev, N. N.; Diamond, L. W. Thermodynamic description of aqueous nonelectrolytes at infinite dilution over a wide range of state parameters. Geochim. Cosmochim. Acta 2003, 67 (4), 613– 629, DOI: 10.1016/S0016-7037(02)01141-9There is no corresponding record for this reference.
- 57Ho, P. C.; Palmer, D. A.; Wood, R. H. Conductivity Measurements of Dilute Aqueous LiOH, NaOH, and KOH Solutions to High Temperatures and Pressures Using a Flow-Through Cell. J. Phys. Chem. B 2000, 104 (50), 12084– 12089, DOI: 10.1021/jp000845xThere is no corresponding record for this reference.
- 58Gimblett, F. G. R.; Monk, C. B. E. . m.f. studies of electrolytic dissociation. Part 7.─Some alkali and alkaline earth metal hydroxides in water. Trans. Faraday Soc. 1954, 50 (0), 965– 972, DOI: 10.1039/TF9545000965There is no corresponding record for this reference.
- 59Shcherbakov, V. N.; Lukashov, Y. Y.; Lukashov, Y. M. Electrolytical properties of solutions of lithium hydroxide at high temperatures and pressures. Therm. Eng. 2013, 60 (4), 280– 284, DOI: 10.1134/S0040601513040125There is no corresponding record for this reference.
- 60Corti, H.; Crovetto, R.; Fernndez-Prini, R. Aqueous solutions of lithium hydroxide at various temperatures: Conductivity and activity coefficients. J. Solution Chem. 1979, 8 (12), 897– 908, DOI: 10.1007/BF00644886There is no corresponding record for this reference.
- 61Read, A. J. Ionization constants of aqueous ammonia from 25 to 250C and to 2000 bar. J. Solution Chem. 1982, 11 (9), 649– 664, DOI: 10.1007/BF00650397There is no corresponding record for this reference.
- 62Sverjensky, D. A.; Hemley, J. J.; D’angelo, W. M. Thermodynamic assessment of hydrothermal alkali feldspar-mica-aluminosilicate equilibria. Geochim. Cosmochim. Acta 1991, 55 (4), 989– 1004, DOI: 10.1016/0016-7037(91)90157-ZThere is no corresponding record for this reference.
- 63Bianchi, H.; Corti, H. R.; Fernndez-Prini, R. Electrical conductivity of aqueous sodium hydroxide solutions at high temperatures. J. Solution Chem. 1994, 23 (11), 1203– 1212, DOI: 10.1007/BF00974030There is no corresponding record for this reference.
- 64Benezeth, P.; Castet, S.; Dandurand, J.-L.; Gout, R.; Schott, J. Experimental study of aluminum-acetate complexing between 60 and 200°c. Geochim. Cosmochim. Acta 1994, 58 (21), 4561– 4571, DOI: 10.1016/0016-7037(94)90191-0There is no corresponding record for this reference.
- 65Shock, E. L.; Koretsky, C. M. Metal-organic complexes in geochemical processes: Calculation of standard partial molal thermodynamic properties of aqueous acetate complexes at high pressures and temperatures. Geochim. Cosmochim. Acta 1993, 57 (20), 4899– 4922, DOI: 10.1016/0016-7037(93)90128-jThere is no corresponding record for this reference.
- 66Fournier, P.; Gout, R.; Oelkers, E. H. A Raman Spectrographic and Potentiometric Study of Aqueous Lithium and Potassium Acetate Complexation at Temperatures from 20 to 200 ◦C. J. Solution Chem. 2005, 34 (8), 881– 898, DOI: 10.1007/s10953-005-6251-xThere is no corresponding record for this reference.
- 67Daniele, P. G.; De Robertis, A.; De Stefano, C.; Sammartano, S.; Rigano, C. On the possibility of determining the thermodynamic parameters for the formation of weak complexes using a simple model for the dependence on ionic strength of activity coefficients: Na+, K+, and Ca2+ complexes of low molecular weight ligands in aqueous solution. J. Chem. Soc., Dalton Trans. 1985, 11, 2353, DOI: 10.1039/DT9850002353There is no corresponding record for this reference.
- 68Archer, D. W.; Monk, C. B. 594 Ion-association constants of some acetates by pH (glass electrode) measurements. J. Chem. Soc. 1964, 3117, DOI: 10.1039/jr9640003117There is no corresponding record for this reference.
- 69Zimmerman, G. H.; Wood, R. H. Conductance of Dilute Sodium Acetate Solutions to 469 K and of Acetic Acid and Sodium Acetate/Acetic Acid Mixtures to 548 K and 20 MPa. J. Solution Chem. 2002, 31 (12), 995– 1017, DOI: 10.1023/A:1021829610606There is no corresponding record for this reference.
- 70Oscarson, J. L.; Gillespie, S. E.; Christensen, J. J.; Izatt, R. M.; Brown, P. R. Thermodynamic quantities for the interaction of H+ and Na+ with C2H3O 2 ? and Cl? in aqueous solution from 275 to 320C. J. Solution Chem. 1988, 17 (9), 865– 885, DOI: 10.1007/BF00646554There is no corresponding record for this reference.
- 71Hemptinne, J.-C. d.; Ferrando, N.; Hajiw-Riberaud, M.; Lachet, V.; Maghsoodloo, S.; Mougin, P.; Ngo, T. D.; Pigeon, L.; Romero Yanes, J.; Wender, A. Carnot: a thermodynamic library for energy industries. Sci. Technol. Energy Transition 2023, 78, 30, DOI: 10.2516/stet/2023023There is no corresponding record for this reference.
- 72Chen, C. C.; Evans, L. B. A local composition model for the excess Gibbs energy of aqueous electrolyte systems. AIChE J. 1986, 32 (3), 444– 454, DOI: 10.1002/aic.690320311There is no corresponding record for this reference.
- 73Chen, C.-C.; britt, H. I.; Boston, J. F.; Evans, L. B. Local composition model for excess Gibbs energy of electrolyte systems. Part I: Single solvent, single completely dissociated electrolyte systems. AIChE J. 1982, 28 (4), 588– 596, DOI: 10.1002/aic.690280410There is no corresponding record for this reference.
- 74Kontogeorgis, G. M.; Voutsas, E. C.; Yakoumis, I. V.; Tassios, D. P. An equation of state for associating fluids. Ind. Eng. Chem. Res. 1996, 35 (11), 4310– 4318, DOI: 10.1021/ie9600203There is no corresponding record for this reference.
- 75Hayden, J. G.; O’Connell, J. P. Generalized method for predicting second virial coefficients. Ind. Eng. Chem. Process Des. Dev.c 1975, 14 (3), 209– 216, DOI: 10.1021/i260055a003There is no corresponding record for this reference.
- 76Wang, S.; Song, Y.; Zhang, Y.; Chen, C.-C. Electrolyte Thermodynamic Models in Aspen Process Simulators and Their Applications. Ind. Eng. Chem. Res. 2022, 61 (42), 15649– 15660, DOI: 10.1021/acs.iecr.2c01881There is no corresponding record for this reference.
- 77Arcis, H.; Bachet, M.; Dickinson, S.; Duncanson, I.; Eaker, R. W.; Jarvis, J.; Johnson, K.; Lee, C. A.; Lord, F.; Marks, C.; Tremaine, P. R. Revised Parameters for the IAPWS Formulation for the Ionization Constant of Water Over a Wide Range of Temperatures and Densities, Including Near-Critical Conditions. J. Phys. Chem. Ref. Data 2024, 53 (2), 23103, DOI: 10.1063/5.0198792There is no corresponding record for this reference.
- 78Tanger, J. C.; Helgeson, H. C. Calculation of the thermodynamic and transport properties of aqueous species at high pressures and temperatures; revised equations of state for the standard partial molal properties of ions and electrolytes. Am. J. Sci. 1988, 288 (1), 19– 98, DOI: 10.2475/ajs.288.1.19There is no corresponding record for this reference.
- 79Fisher, J. R.; Barnes, H. L. Ion-product constant of water to 350 °C. J. Phys. Chem. 1972, 76 (1), 90– 99, DOI: 10.1021/j100645a016There is no corresponding record for this reference.
- 80Robinson, R. A.; Stokes, R. H. Electrolyte Solutions, 2nd ed.; Dover Publications, 2002.There is no corresponding record for this reference.
- 81Gold, V. The IUPAC Compendium of Chemical Terminology; International Union of Pure and Applied Chemistry (IUPAC), 2019.There is no corresponding record for this reference.
- 82Kosinski, J. J.; Wang, P.; Springer, R. D.; Anderko, A. Modeling acid–base equilibria and phase behavior in mixed-solvent electrolyte systems. Fluid Phase Equilib. 2007, 256 (1), 34– 41, DOI: 10.1016/j.fluid.2006.11.018There is no corresponding record for this reference.
- 83Advanced Tools for Optimization and Uncertainty Treatment (ATOUT), 1 User Manual , 2019.There is no corresponding record for this reference.
- 84Hansen, N.; Ostermeier, A. Completely derandomized self-adaptation in evolution strategies. Evol. Comput. 2001, 9 (2), 159– 195, DOI: 10.1162/106365601750190398There is no corresponding record for this reference.
- 85Hansen, N. The CMA Evolution Strategy: A Tutorial. https://arxiv.org/pdf/1604.00772.There is no corresponding record for this reference.
- 86Langouët, H. Optimisation sans dérivées sous contraintes: deux applications industrielles en ingénierie de réservoir et en calibration des moteurs; Thèse de doctorat, Université de Nice-Sophia Antipolis, 2011.There is no corresponding record for this reference.
- 87Valverde, J. L.; Ferro, V. R.; Giroir-Fendler, A. Estimation of e-NRTL binary interaction parameters and its impact on the prediction of thermodynamic properties of multicomponent electrolyte systems. Fluid Phase Equilib. 2022, 551, 113264, DOI: 10.1016/j.fluid.2021.113264There is no corresponding record for this reference.
Supporting Information
Supporting Information
The Supporting Information is available free of charge at https://pubs.acs.org/doi/10.1021/acs.jced.5c00412.
Contains the description of the model and all the parameters that have been used in this work (PDF)
Terms & Conditions
Most electronic Supporting Information files are available without a subscription to ACS Web Editions. Such files may be downloaded by article for research use (if there is a public use license linked to the relevant article, that license may permit other uses). Permission may be obtained from ACS for other uses through requests via the RightsLink permission system: http://pubs.acs.org/page/copyright/permissions.html.