


This publication is Open Access under the license indicated. Learn More

ACS Editors' Choice® is a collection designed to feature scientific articles of broad public interest. Read the latest articles
Surface Tension and Surface Thermodynamics of Aqueous Inorganic Salt Solutions in the Atmospherically Relevant Temperature RangeClick to copy article linkArticle link copied!
- Alexandra GiermannAlexandra GiermannWilhelm-Ostwald-Institut für Physikalische und Theoretische Chemie, Universität Leipzig, Linnéstraße 2, 04103 Leipzig, GermanyMore by Alexandra Giermann
- Manuela Reichelt*Manuela Reichelt*Email: [email protected]Wilhelm-Ostwald-Institut für Physikalische und Theoretische Chemie, Universität Leipzig, Linnéstraße 2, 04103 Leipzig, GermanyMore by Manuela Reichelt
Journal of Chemical & Engineering Data
Copyright © 2025 The Authors. Published by American Chemical Society. This publication is licensed under
License Summary*
You are free to share (copy and redistribute) this article in any medium or format and to adapt (remix, transform, and build upon) the material for any purpose, even commercially within the parameters below:

Creative Commons (CC): This is a Creative Commons license.

Attribution (BY): Credit must be given to the creator.
*Disclaimer
This summary highlights only some of the key features and terms of the actual license. It is not a license and has no legal value. Carefully review the actual license before using these materials.
Abstract
The surface tension γ of aqueous solutions of NaCl, NaBr, NaI, LiCl, KCl, MgCl2, and Na2SO4 (0.1 mol·kg–1 to 5 mol·kg–1 in maximum) was investigated within the atmospheric relevant temperature range of 263.15 to 293.15 K. The measured densities ρ of the aqueous inorganic salt solutions between 278.15 and 293.15 K are also reported. From experimental data the excess surface tension Δγ, the concentration (as molality m) and temperature derivatives, (dγ/dm)T, p and (dγ/dT)p, m as well as thermodynamic quantities of surface formation such as surface excess entropy , surface excess Helmholtz energy , surface excess energy , and surface excess enthalpy were estimated. The surface excess entropy decreases slightly with increasing molality of the inorganic salt, which shows a weak order dependence of the water molecules on the salt concentration. The surface tension data and thermodynamic quantities complement existing data sets especially at temperatures below 283.15 K.
This publication is licensed under
License Summary*
You are free to share(copy and redistribute) this article in any medium or format and to adapt(remix, transform, and build upon) the material for any purpose, even commercially within the parameters below:
Creative Commons (CC): This is a Creative Commons license.
Attribution (BY): Credit must be given to the creator.
*Disclaimer
This summary highlights only some of the key features and terms of the actual license. It is not a license and has no legal value. Carefully review the actual license before using these materials.
1. Introduction
2. Experimental Methods
2.1. Materials
| chemical | CAS | supplier | purity in mass fraction w |
|---|---|---|---|
| KCl | 7447-40-7 | Merck | >99.0% |
| LiCl | 7447-41-8 | Fluka | >99.0% |
| MgCl2 × 6H2O | 7791-18-6 | Merck | >99.0% |
| NaBr | 7647-15-6 | Riedel de Haen | >99.0% |
| NaCl | 7647-14-5 | VWR | 99.9% |
| NaI | 7681-82-5 | Fluka/Merck | >99.0%/99.99% |
| Na2SO4 | 7757-82-6 | Merck | 99.99% |
The purity values are provided by the respective supplier.
2.2. Experimental Procedure
| ρ/kg·m–3 | |||||
|---|---|---|---|---|---|
| salt | m/mol·kg–1 | 278.15 K | 283.15 K | 288.15 K | 293.15 K |
| NaCl | 0.096 | 1004.16 | 1003.81 | 1003.13 | 1002.18 |
| 0.203 | 1008.75 | 1008.31 | 1007.57 | 1006.55 | |
| 0.463 | 1019.73 | 1019.09 | 1018.16 | 1017.01 | |
| 0.733 | 1030.88 | 1030.04 | 1028.96 | 1027.68 | |
| 0.984 | 1040.83 | 1039.83 | 1038.62 | 1037.21 | |
| 1.498 | 1060.51 | 1059.24 | 1057.80 | 1056.18 | |
| 1.987 | 1078.58 | 1077.08 | 1075.44 | 1073.62 | |
| 2.973 | 1112.86 | 1111.02 | 1109.05 | 1106.98 | |
| 4.015 | 1146.70 | 1144.55 | 1142.32 | 1140.01 | |
| 5.005 | 1176.23 | 1173.87 | 1171.46 | 1168.97 | |
| NaBr | 0.116 | 1009.42 | 1009.04 | 1008.35 | 1007.37 |
| 0.203 | 1016.45 | 1015.99 | 1015.21 | 1014.16 | |
| 0.464 | 1036.96 | 1036.27 | 1035.30 | 1034.08 | |
| 0.752 | 1059.23 | 1058.30 | 1057.13 | 1055.71 | |
| 0.988 | 1077.64 | 1076.52 | 1075.19 | 1073.63 | |
| 1.495 | 1114.24 | 1112.78 | 1111.13 | 1109.30 | |
| 2.994 | 1217.04 | 1214.76 | 1212.39 | 1209.88 | |
| 3.971 | 1278.85 | 1276.17 | 1273.41 | 1270.62 | |
| 5.046 | 1343.76 | 1340.69 | 1337.55 | 1334.43 | |
| NaI | 0.111 | 1013.00 | 1012.61 | 1011.89 | 1010.89 |
| 0.143 | 1016.80 | 1016.37 | 1015.63 | 1014.58 | |
| 0.197 | 1022.63 | 1022.14 | 1021.34 | 1020.27 | |
| 0.513 | 1057.92 | 1057.10 | 1055.99 | 1054.66 | |
| 0.530 | 1060.77 | 1059.93 | 1058.80 | 1057.46 | |
| 0.747 | 1082.94 | 1081.80 | 1080.43 | 1078.89 | |
| 0.994 | 1111.85 | 1110.54 | 1109.01 | 1107.30 | |
| 0.997 | 1110.05 | 1108.75 | 1107.23 | 1105.52 | |
| 1.530 | 1164.64 | 1162.89 | 1160.94 | 1158.88 | |
| 2.085 | 1219.62 | 1217.44 | 1215.11 | 1212.64 | |
| 2.772 | 1286.16 | 1283.48 | 1280.71 | 1277.84 | |
| 3.833 | 1373.57 | 1370.34 | 1367.02 | 1363.64 | |
| 4.664 | 1450.34 | 1446.64 | 1442.93 | 1439.17 | |
| LiCl | 0.106 | 1002.76 | 1002.45 | 1001.81 | 1000.89 |
| 0.202 | 1005.01 | 1004.68 | 1004.02 | 1003.07 | |
| 0.499 | 1012.17 | 1011.74 | 1011.01 | 1010.01 | |
| 0.748 | 1018.00 | 1017.49 | 1016.71 | 1015.70 | |
| 1.014 | 1024.03 | 1023.46 | 1022.62 | 1021.56 | |
| 1.561 | 1036.96 | 1036.25 | 1035.32 | 1034.18 | |
| 2.363 | 1053.70 | 1051.84 | 1051.83 | 1050.62 | |
| 2.985 | 1066.20 | 1065.28 | 1064.20 | 1062.98 | |
| 4.141 | 1088.05 | 1087.01 | 1085.86 | 1084.59 | |
| 4.920 | 1101.73 | 1100.65 | 1099.45 | 1098.16 | |
| KCl | 0.118 | 1005.74 | 1005.38 | 1004.71 | 1003.74 |
| 0.204 | 1009.95 | 1009.54 | 1008.80 | 1007.81 | |
| 0.541 | 1025.76 | 1025.12 | 1024.21 | 1023.07 | |
| 0.752 | 1035.32 | 1034.55 | 1033.54 | 1032.32 | |
| 1.011 | 1046.74 | 1045.84 | 1044.72 | 1043.34 | |
| 1.409 | 1063.70 | 1062.61 | 1061.33 | 1059.85 | |
| 1.930 | 1084.99 | 1083.71 | 1082.25 | 1080.59 | |
| 3.086 | 1132.30 | 1130.66 | 1128.88 | 1127.03 | |
| 4.023 | 1160.65 | 1158.84 | 1156.93 | 1154.87 | |
| MgCl2 | 0.099 | 1007.97 | 1007.62 | 1006.96 | 1006.02 |
| 0.212 | 1016.91 | 1016.47 | 1015.73 | 1014.75 | |
| 0.487 | 1038.09 | 1037.45 | 1036.57 | 1035.45 | |
| 0.698 | 1053.56 | 1052.80 | 1051.82 | 1050.63 | |
| 0.942 | 1071.26 | 1070.37 | 1069.28 | 1068.01 | |
| 1.314 | 1096.66 | 1095.61 | 1094.40 | 1093.04 | |
| 1.633 | 1117.92 | 1116.77 | 1115.46 | 1114.02 | |
| 2.301 | 1158.40 | 1158.48 | 1157.05 | 1155.50 | |
| 2.776 | 1187.98 | 1186.56 | 1185.05 | 1183.46 | |
| 3.201 | 1211.84 | 1210.35 | 1208.79 | 1207.15 | |
| Na2SO4 | 0.088 | 1011.89 | 1011.43 | 1010.66 | 1009.65 |
| 0.235 | 1030.56 | 1029.83 | 1028.84 | 1027.60 | |
| 0.495 | 1063.55 | 1062.35 | 1060.39 | 1058.54 | |
| 0.730 | 1089.89 | 1088.52 | 1086.95 | 1085.25 | |
| 0.930 | 1110.96 | 1109.34 | 1107.56 | 1105.63 | |
The combined standard uncertainties are as follows: molality values uc(m) = 0.0002 mol·kg–1 and density values uc(ρ) = 0.34 kg·m–3. The standard uncertainty of the temperature is u(T) = 0.01 K. See Chapter S6 in SI for more details.
| γ/mN·m–1 | |||||||||
|---|---|---|---|---|---|---|---|---|---|
| m/mol·kg–1 | 263.15 K | 268.15 K | 271.15 K | 273.15 K | 278.15 K | 283.15 K | 288.15 K | 293.15 K | |
| NaCl | 0.096 | 75.49 | 75.29 | 74.46 | 73.68 | 73.04 | 72.16 | ||
| 0.203 | 76.55 | 76.06 | 75.73 | 74.93 | 74.20 | 73.47 | 72.56 | ||
| 0.463 | 77.31 | 76.94 | 76.56 | 75.64 | 75.05 | 74.15 | 73.25 | ||
| 0.733 | 77.62 | 77.31 | 76.91 | 75.85 | 75.17 | 74.70 | 73.39 | ||
| 0.984 | 78.43 | 77.93 | 77.64 | 76.70 | 75.94 | 74.94 | 73.78 | ||
| 1.498 | 80.31 | 79.44 | 78.91 | 78.53 | 77.65 | 76.62 | 75.75 | 74.46 | |
| 1.987 | 78.65 | 78.10 | 77.89 | 76.97 | 76.47 | 75.66 | 75.00 | ||
| 2.973 | 79.83 | 79.23 | 78.90 | 78.42 | 77.85 | 77.24 | 76.34 | 75.55 | |
| 4.015 | 82.48 | 81.88 | 81.53 | 81.27 | 80.55 | 80.09 | 79.28 | 78.30 | |
| 5.005 | 83.51 | 83.15 | 82.92 | 82.81 | 82.14 | 81.55 | 80.69 | 79.90 | |
| NaBr | 0.116 | 75.96 | 75.59 | 74.73 | 73.96 | 72.91 | 72.29 | ||
| 0.203 | 76.48 | 75.99 | 75.68 | 74.81 | 74.04 | 73.17 | 72.57 | ||
| 0.464 | 77.06 | 76.60 | 76.34 | 75.39 | 74.71 | 73.83 | 72.69 | ||
| 0.752 | 77.27 | 76.67 | 76.39 | 75.35 | 74.78 | 73.79 | 72.83 | ||
| 0.988 | 77.58 | 76.97 | 76.80 | 76.03 | 75.32 | 74.41 | 73.42 | ||
| 1.495 | 78.65 | 78.18 | 77.70 | 77.43 | 76.52 | 75.64 | 74.70 | 73.42 | |
| 2.994 | 79.66 | 79.11 | 78.64 | 78.27 | 77.55 | 76.79 | 75.92 | 75.10 | |
| 3.971 | 80.51 | 80.22 | 79.82 | 79.59 | 78.78 | 78.03 | 77.40 | 76.35 | |
| 5.046 | 81.50 | 81.11 | 80.87 | 80.61 | 80.05 | 79.46 | 78.73 | 77.84 | |
| NaI | 0.111 | 76.17 | 75.65 | 74.78 | 73.86 | 72.89 | 71.67 | ||
| 0.143 | 75.54 | 75.21 | 75.00 | 74.02 | 73.61 | 72.87 | 71.91 | ||
| 0.197 | 76.24 | 75.76 | 75.44 | 74.65 | 73.91 | 73.05 | 72.03 | ||
| 0.513 | 76.59 | 76.21 | 76.06 | 75.22 | 74.60 | 73.71 | 72.78 | ||
| 0.530 | 77.16 | 76.78 | 76.46 | 75.60 | 74.95 | 74.09 | 73.04 | ||
| 0.747 | 76.91 | 76.45 | 76.05 | 75.18 | 74.37 | 73.46 | 72.53 | ||
| 0.994 | 76.43 | 76.00 | 75.69 | 75.06 | 74.27 | 73.41 | 72.75 | ||
| 0.997 | 77.23 | 76.78 | 76.34 | 75.64 | 74.86 | 73.90 | 72.99 | ||
| 1.530 | 77.00 | 76.49 | 75.98 | 75.81 | 75.08 | 74.39 | 73.63 | 72.71 | |
| 2.085 | 77.28 | 76.60 | 76.20 | 75.80 | 75.16 | 74.46 | 73.51 | 72.66 | |
| 2.772 | 76.66 | 76.08 | 75.70 | 75.51 | 75.04 | 74.45 | 73.84 | 73.01 | |
| 3.833 | 76.94 | 76.34 | 75.96 | 75.75 | 75.05 | 74.40 | 73.66 | 72.71 | |
| 4.664 | 77.40 | 76.79 | 76.48 | 76.26 | 75.39 | 74.99 | 74.21 | 73.29 | |
| LiCl | 0.106 | 75.90 | 75.51 | 74.51 | 73.89 | 72.93 | 72.14 | ||
| 0.202 | 76.59 | 76.08 | 75.83 | 75.08 | 74.48 | 73.61 | 72.72 | ||
| 0.499 | 78.83 | 78.20 | 77.94 | 77.14 | 76.53 | 75.70 | 75.17 | ||
| 0.748 | 77.83 | 77.46 | 77.12 | 76.07 | 75.52 | 74.64 | 73.75 | ||
| 1.014 | 78.78 | 78.21 | 78.03 | 77.30 | 76.55 | 75.72 | 75.01 | ||
| 1.561 | 78.91 | 78.35 | 77.94 | 77.75 | 76.76 | 75.98 | 75.20 | 74.30 | |
| 2.363 | 79.39 | 78.97 | 78.56 | 78.29 | 77.63 | 76.93 | 76.03 | 75.00 | |
| 2.985 | 80.94 | 80.52 | 80.17 | 79.88 | 79.11 | 78.65 | 77.83 | 77.12 | |
| 4.141 | 82.15 | 81.78 | 81.39 | 81.11 | 80.38 | 80.01 | 79.37 | 78.54 | |
| 4.920 | 84.03 | 83.67 | 83.47 | 83.32 | 82.60 | 82.03 | 81.41 | 80.59 | |
| KCl | 0.118 | 76.11 | 75.89 | 74.94 | 74.38 | 73.63 | 72.90 | ||
| 0.204 | 77.33 | 76.94 | 76.58 | 75.71 | 75.06 | 74.15 | 73.40 | ||
| 0.541 | 77.25 | 76.82 | 76.72 | 75.84 | 75.21 | 74.41 | 73.60 | ||
| 0.752 | 78.34 | 77.97 | 77.74 | 76.83 | 76.24 | 75.66 | 74.89 | ||
| 1.011 | 77.53 | 77.14 | 76.83 | 75.97 | 75.31 | 74.39 | 73.42 | ||
| 1.409 | 79.18 | 78.53 | 78.09 | 77.91 | 77.10 | 76.46 | 75.65 | 75.03 | |
| 1.930 | 79.21 | 78.64 | 78.27 | 78.01 | 77.37 | 76.74 | 75.97 | 75.22 | |
| 3.086 | 80.37 | 79.91 | 79.55 | 79.39 | 78.66 | 78.00 | 77.44 | 76.80 | |
| 4.023 | 81.45 | 80.46 | 80.31 | 80.39 | 79.87 | 79.25 | 78.48 | 77.87 | |
| MgCl2 | 0.099 | 77.33 | 77.01 | 76.26 | 75.54 | 74.82 | 74.23 | ||
| 0.212 | 77.48 | 76.95 | 76.67 | 75.97 | 75.27 | 74.62 | 73.86 | ||
| 0.487 | 77.06 | 77.08 | 76.73 | 75.79 | 75.13 | 74.35 | 73.70 | ||
| 0.698 | 77.82 | 77.27 | 77.00 | 76.09 | 75.30 | 74.46 | 73.66 | ||
| 0.942 | 78.96 | 78.44 | 78.19 | 77.59 | 76.89 | 76.00 | 75.46 | ||
| 1.314 | 80.74 | 80.38 | 79.86 | 79.63 | 78.80 | 78.13 | 77.46 | 76.61 | |
| 1.633 | 81.53 | 80.96 | 80.65 | 80.36 | 79.57 | 79.07 | 78.23 | 77.59 | |
| 2.301 | 84.48 | 83.83 | 83.47 | 83.04 | 82.47 | 81.87 | 81.21 | 80.73 | |
| 2.776 | 85.83 | 85.30 | 84.98 | 84.69 | 83.90 | 83.31 | 82.75 | 82.23 | |
| 3.201 | 87.62 | 87.03 | 86.80 | 86.50 | 85.80 | 85.35 | 84.56 | 83.89 | |
| Na2SO4 | 0.088 | 75.90 | 75.45 | 74.80 | 74.21 | 73.54 | 72.71 | ||
| 0.235 | 77.57 | 77.07 | 76.84 | 75.96 | 75.32 | 74.53 | 73.39 | ||
| 0.495 | 76.56 | 76.15 | 75.88 | 75.32 | 74.74 | 74.10 | 73.50 | ||
| 0.730 | 78.68 | 78.35 | 77.92 | 77.03 | 76.24 | 75.33 | 74.53 | ||
| 0.930 | 78.92 | 78.80 | 78.59 | 78.00 | 77.35 | 76.47 | 75.63 | ||
The combined standard uncertainty of the molality values amounts to uc(m) = 0.0002 mol·kg–1. The combined standard uncertainty of the surface tension values, uc(γ), are given in Table S6 in SI. The standard uncertainty of the temperature is u(T) = 0.1 K. See Chapter S6 in SI for more details.
2.3. Density Measurements
2.4. Surface Tension Measurements
3. Results and Discussion
3.1. Density
Figure 1
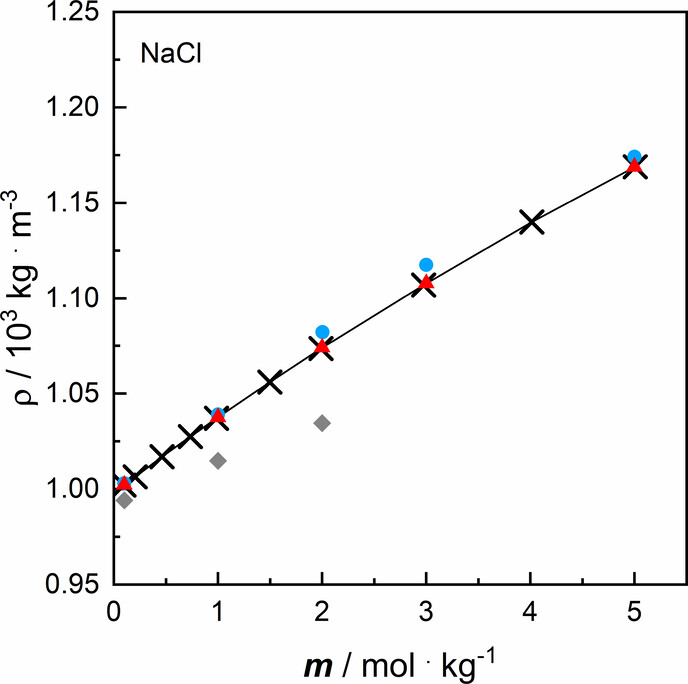
Figure 1. Density ρ of aqueous salt solutions of NaCl as a function of molality m at a temperature T = 293.15 K and at a pressure p = 100,000 Pa for: solid line and × own data (cf. Table 2) in comparison with data from literature: blue ● Hoffert et al., (47) red ▲ Rogers and Pitzer, (48) and gray ◆ Shah et al. (41) Note that the reference data from Rogers and Pitzer are given as specific volumes and were converted into density for comparison.
3.2. Surface Tension
Figure 2
Figure 2. Surface tension γ of aqueous salt solutions of NaCl as a function of temperature T at a pressure p = 100,000 Pa for own data at: ■ 2.994 mol·kg–1, blue ● 1.997 mol·kg–1, gray ▲ 0.984 mol·kg–1 (cf. Table 3) and data from literature (42) at: □ 3.020 mol·kg–1, blue ○ 1.901 mol·kg–1, gray △ 0.901 mol·kg–1. The concentrations of the reference data are given in mass fractions and were converted into molality for comparison (cf. Chapter S1 in the SI).
Figure 3
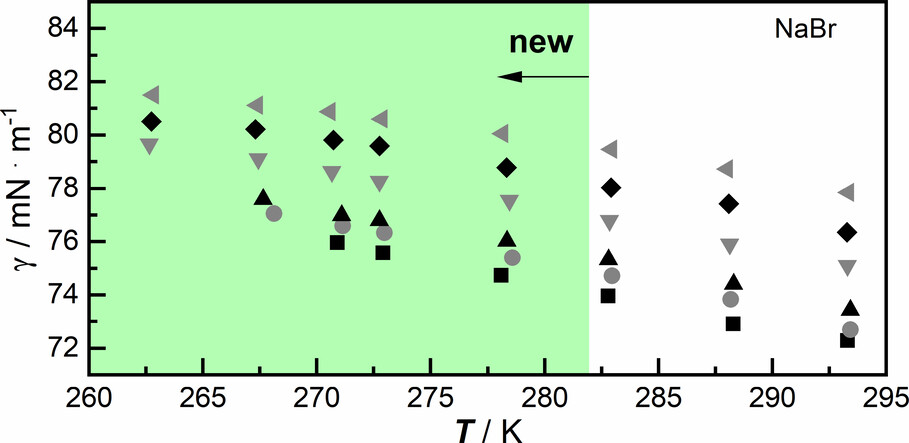
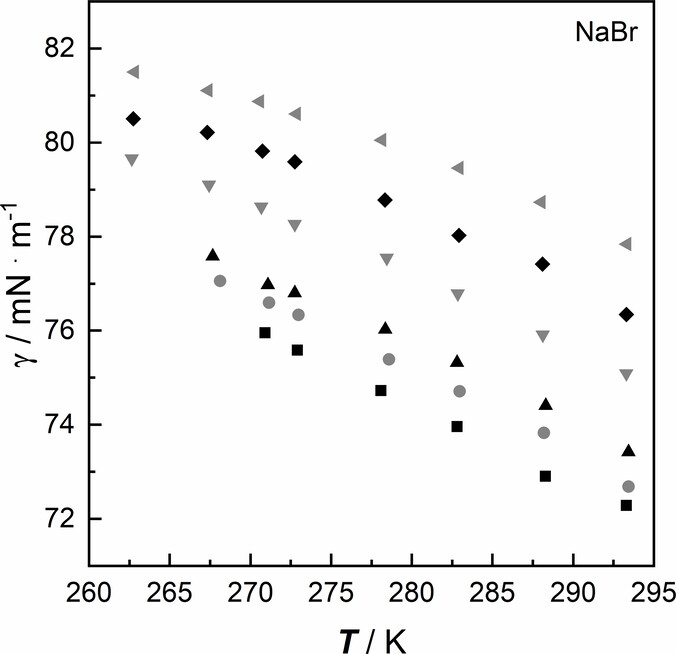
Figure 3. Surface tension γ of aqueous salt solutions of NaBr as a function of temperature T at a pressure p = 100,000 Pa: ■ 0.116 mol·kg–1, gray ● 0.464 mol·kg–1, ▲ 0.988 mol·kg–1, gray ▼ 2.994 mol·kg–1, ◆ 3.971 mol·kg–1, gray ◀ 5.046 mol·kg–1 (cf. Table 3).
Figure 4
Figure 4. Surface tension γ of aqueous salt solutions of NaBr as a function of molality m at a pressure p = 100,000 Pa: Solid and dotted lines result from linear fit at ■ 293.15 K, gray ● 288.15 K, ▲ 283.15 K, gray ▼ 278.15 K, ◆ 273.15 K, gray ◀ 271.15 K, ▶ 268.15 K, gray × 263.15 K (cf. Table 3).
3.3. Excess Surface Tension
Figure 5
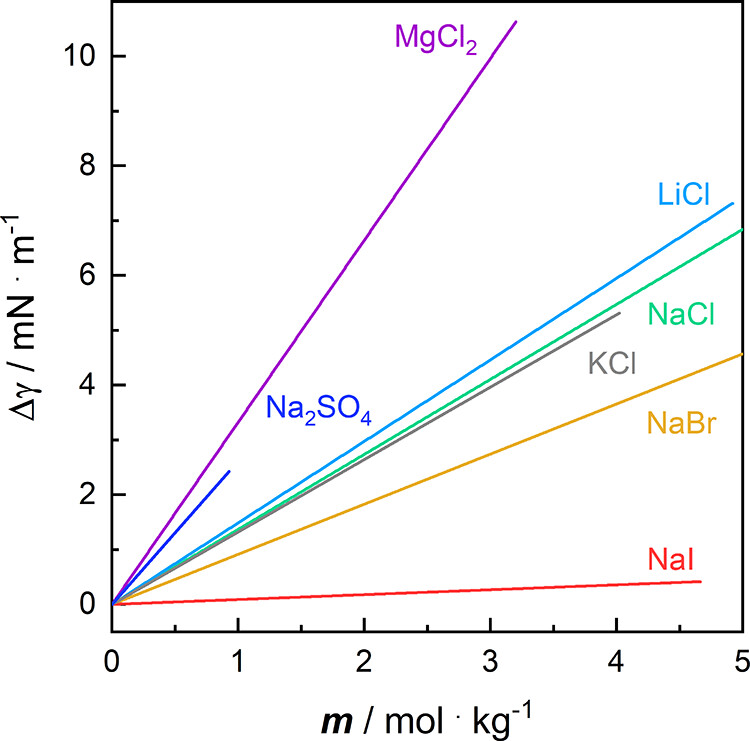
Figure 5. Linear fit results of the excess surface tension Δγ of aqueous salt solutions as a function of molality m at a temperature T = 293.15 K and a pressure p = 100,000 Pa of green ─ NaCl, orange ─ NaBr, red ─ NaI, sky blue ─ LiCl, gray ─ KCl, purple ─ MgCl2, and blue ─ Na2SO4. (cf. Figures S16 and S17). See Chapter 10 in the SI for more information on fitting the experimental data.
3.4. Surface Tension Gradient
| (dγ/dm)T, p/mJ·kg·m–2·mol–1 | |||||||
|---|---|---|---|---|---|---|---|
| T/K | NaCl | NaBr | NaI | LiCl | KCl | MgCl2 | Na2SO4 |
| 271.15 | 1.321 ± 0.129 | 0.966 ± 0.034 | 0.026 ± 0.090 | 1.328 ± 0.138 | 0.969 ± 0.104 | 3.400 ± 0.227 | 3.203 ± 1.114 |
| 273.15 | 1.345 ± 0.131 | 0.972 ± 0.044 | 0.056 ± 0.081 | 1.346 ± 0.144 | 1.036 ± 0.103 | 3.377 ± 0.212 | 3.311 ± 1.122 |
| 278.15 | 1.402 ± 0.118 | 1.031 ± 0.042 | 0.090 ± 0.082 | 1.387 ± 0.149 | 1.132 ± 0.101 | 3.301 ± 0.207 | 3.372 ± 0.948 |
| 283.15 | 1.448 ± 0.106 | 1.043 ± 0.045 | 0.137 ± 0.075 | 1.422 ± 0.149 | 1.124 ± 0.102 | 3.268 ± 0.191 | 3.247 ± 0.909 |
| 288.15 | 1.419 ± 0.104 | 1.100 ± 0.049 | 0.173 ± 0.070 | 1.475 ± 0.156 | 1.156 ± 0.120 | 3.278 ± 0.195 | 3.003 ± 0.798 |
| 293.15 | 1.462 ± 0.083 | 1.077 ± 0.045 | 0.199 ± 0.078 | 1.463 ± 0.179 | 1.203 ± 0.134 | 3.426 ± 0.156 | 3.177 ± 0.523 |
The standard uncertainty of the temperature amounts to u(T) = 0.1 K. The standard uncertainties of the gradient values u((dγ/dm)T, p) are taken from least-squares linear regression analysis.
| (dγ/dm)T, p/mJ·kg·m–2·mol–1 | |||||||
|---|---|---|---|---|---|---|---|
| method | NaCl | NaBr | NaI | LiCl | KCl | MgCl2 | Na2SO4 |
| mBPMb | 2.08 | 1.83 | 1.23 | 1.98 | 1.85 | 4.06 | 2.90 |
| mBPMc | 1.76 | 1.71 | - | - | 1.68 | 3.73 | 2.99 |
| DVd | 1.70 | - | - | 1.58 | 1.59 | - | 2.66 |
| DVe | - | - | - | 1.38 | 1.49 | - | - |
| DVf | 1.41 | 1.19 | 0.97 | - | - | - | - |
| WPg | 1.75 | - | 1.21 | - | 1.65 | - | - |
Note that the concentration in b and c is given in molarity and is not converted into molality. For this, the gradient is (dγ/dM)T, p/mJ·L·m–2·mol–1. A conversion into molalities was omitted. The abbreviations mean as follows: mBPM – maximum bubble pressure method, DV – drop volume method, WP – Wilhelmy plate method
Data from Weissenborn and Pugh (39,40) at T = 294.15–301.15 K and for 0.05–1 mol·l–1 solutions.
Data from Henry et al. (38) at T = 293.15 K and for 0.5 to 3 mol·l–1 solutions.
Data from Aveyard and Saleem (37) at T = 293.15 K and 0.1–1 mol·kg–1 NaCl solutions, 0.2–1.5 mol·kg–1 KCl solutions, 0.2–1.0 mol·kg–1 Na2SO4 solutions.
Data from Matubayasi et al. (31) at T = 293.15 K and 0.1–1 mol·kg–1 solutions.
Data from Matubayasi et al. (32) at T = 293.15 K and 0.1–1 mol·kg–1 solutions.
Data from Johansson and Eriksson (35) at T = 298.15 K and 0.1–1 mol·kg–1 NaCl and NaI solutions, 0.1–1.5 mol·kg–1 KCl solutions.
3.5. Thermodynamic Quantities of Surface Formation
| salt | m/mol·kg–1 | Δsσ/mJ·K–1·m–2 | Δuσ/mJ·m–2 | Δhσ/mJ·m–2 | |||
|---|---|---|---|---|---|---|---|
| NaCl | 0.096 | 0.1509 | ±0.0038 | 116.4433 | ±1.0825 | 44.2345 | ±1.1434 |
| 0.203 | 0.1560 | ±0.0016 | 118.3353 | ±0.4433 | 45.7342 | ±0.4778 | |
| 0.463 | 0.1635 | ±0.0032 | 121.2163 | ±0.9061 | 47.9206 | ±0.9609 | |
| 0.733 | 0.1638 | ±0.0097 | 121.5607 | ±2.7389 | 48.0049 | ±2.8731 | |
| 0.984 | 0.1816 | ±0.0050 | 127.1595 | ±1.4185 | 53.2297 | ±1.4980 | |
| 1.498 | 0.1944 | ±0.0063 | 131.6060 | ±1.7731 | 56.9840 | ±1.8686 | |
| 1.987 | 0.1413 | ±0.0031 | 116.4144 | ±0.8676 | 41.4261 | ±0.9183 | |
| 2.973 | 0.1433 | ±0.0055 | 117.6466 | ±1.5518 | 42.0164 | ±1.6331 | |
| 4.015 | 0.1387 | ±0.0067 | 119.1521 | ±1.8869 | 40.6633 | ±1.9813 | |
| 5.005 | 0.1366 | ±0.0066 | 120.0873 | ±1.8613 | 40.0578 | ±1.9536 | |
| NaBr | 0.116 | 0.1667 | ±0.0040 | 121.0866 | ±1.1281 | 48.8646 | ±1.1929 |
| 0.203 | 0.1582 | ±0.0037 | 118.8695 | ±1.0330 | 46.3885 | ±1.0924 | |
| 0.464 | 0.1725 | ±0.0051 | 123.4361 | ±1.4396 | 50.5688 | ±1.5173 | |
| 0.752 | 0.1684 | ±0.0037 | 122.2627 | ±1.0379 | 49.3651 | ±1.0997 | |
| 0.988 | 0.1583 | ±0.0057 | 119.9938 | ±1.5920 | 46.4065 | ±1.6753 | |
| 1.495 | 0.1865 | ±0.0069 | 128.3121 | ±1.9384 | 54.6743 | ±2.0400 | |
| 2.994 | 0.1559 | ±0.0034 | 120.8511 | ±0.9468 | 45.6965 | ±1.0028 | |
| 3.971 | 0.1511 | ±0.0055 | 120.8056 | ±1.5559 | 44.3081 | ±1.6375 | |
| 5.046 | 0.1309 | ±0.0059 | 116.3658 | ±1.6608 | 38.3648 | ±1.7451 | |
| NaI | 0.111 | 0.1970 | ±0.0046 | 129.5423 | ±1.2814 | 57.7419 | ±1.3554 |
| 0.143 | 0.1445 | ±0.0069 | 114.3908 | ±1.9428 | 42.3523 | ±2.0393 | |
| 0.197 | 0.1669 | ±0.0040 | 121.0629 | ±1.1118 | 48.9205 | ±1.1754 | |
| 0.513 | 0.1537 | ±0.0052 | 117.9655 | ±1.4626 | 45.0625 | ±1.5403 | |
| 0.530 | 0.1616 | ±0.0044 | 120.5451 | ±1.2294 | 47.3609 | ±1.2983 | |
| 0.747 | 0.1698 | ±0.0021 | 122.3612 | ±0.5877 | 49.7820 | ±0.6303 | |
| 0.994 | 0.1475 | ±0.0040 | 115.9751 | ±1.1272 | 43.2261 | ±1.1899 | |
| 0.997 | 0.1638 | ±0.0047 | 121.0817 | ±1.3116 | 48.0146 | ±1.3850 | |
| 1.530 | 0.1447 | ±0.0049 | 115.2674 | ±1.3670 | 42.4283 | ±1.4400 | |
| 2.085 | 0.1554 | ±0.0050 | 118.3054 | ±1.3932 | 45.5624 | ±1.4684 | |
| 2.772 | 0.1181 | ±0.0063 | 107.7911 | ±1.7801 | 34.6292 | ±1.8679 | |
| 3.833 | 0.1419 | ±0.0055 | 114.4380 | ±1.5468 | 41.5853 | ±1.6277 | |
| 4.664 | 0.1379 | ±0.0054 | 113.8483 | ±1.5085 | 40.4203 | ±1.5869 | |
| LiCl | 0.106 | 0.1711 | ±0.0026 | 122.2650 | ±0.7367 | 50.1435 | ±0.7845 |
| 0.202 | 0.1512 | ±0.0038 | 117.1506 | ±1.0718 | 44.3276 | ±1.1322 | |
| 0.499 | 0.1410 | ±0.0043 | 116.4026 | ±1.2022 | 41.3199 | ±1.2673 | |
| 0.748 | 0.1677 | ±0.0035 | 122.9118 | ±0.9752 | 49.1579 | ±1.0330 | |
| 1.014 | 0.1468 | ±0.0028 | 118.0374 | ±0.7904 | 43.0213 | ±0.8390 | |
| 1.561 | 0.1656 | ±0.0034 | 122.8650 | ±0.9468 | 48.5391 | ±1.0036 | |
| 2.363 | 0.1565 | ±0.0077 | 121.0421 | ±2.1624 | 45.8661 | ±2.2704 | |
| 2.985 | 0.1359 | ±0.0031 | 116.9841 | ±0.8649 | 39.8466 | ±0.9156 | |
| 4.141 | 0.1210 | ±0.0038 | 114.1376 | ±1.0780 | 35.4588 | ±1.1358 | |
| 4.920 | 0.1303 | ±0.0034 | 118.8528 | ±0.9480 | 38.2061 | ±1.0018 | |
| KCl | 0.118 | 0.1462 | ±0.0020 | 115.7361 | ±0.5664 | 42.8459 | ±0.6050 |
| 0.204 | 0.1581 | ±0.0029 | 119.7337 | ±0.8220 | 46.3380 | ±0.8728 | |
| 0.541 | 0.1459 | ±0.0027 | 116.4182 | ±0.7480 | 42.7572 | ±0.7941 | |
| 0.752 | 0.1361 | ±0.0036 | 114.8167 | ±1.0035 | 39.9121 | ±1.0600 | |
| 1.011 | 0.1599 | ±0.0047 | 120.4518 | ±1.3246 | 46.8833 | ±1.3972 | |
| 1.409 | 0.1404 | ±0.0027 | 116.1949 | ±0.7488 | 41.1679 | ±0.7943 | |
| 1.930 | 0.1323 | ±0.0039 | 114.0987 | ±1.1000 | 38.7942 | ±1.1608 | |
| 3.086 | 0.1253 | ±0.0018 | 113.5204 | ±0.5017 | 36.7453 | ±0.5359 | |
| 4.023 | 0.1146 | ±0.0093 | 111.5716 | ±2.6279 | 33.5971 | ±2.7514 | |
| MgCl2 | 0.099 | 0.1419 | ±0.0030 | 115.7444 | ±0.8339 | 41.5889 | ±0.8835 |
| 0.212 | 0.1418 | ±0.0011 | 115.4515 | ±0.3026 | 41.5779 | ±0.3294 | |
| 0.487 | 0.1540 | ±0.0039 | 118.7758 | ±1.1106 | 45.1433 | ±1.1725 | |
| 0.698 | 0.1642 | ±0.0019 | 121.7893 | ±0.5403 | 48.1280 | ±0.5795 | |
| 0.942 | 0.1369 | ±0.0046 | 115.5453 | ±1.2882 | 40.1329 | ±1.3578 | |
| 1.314 | 0.1424 | ±0.0033 | 118.4270 | ±0.9261 | 41.7465 | ±0.9800 | |
| 1.633 | 0.1361 | ±0.0007 | 117.5042 | ±0.1914 | 39.9118 | ±0.2132 | |
| 2.301 | 0.1197 | ±0.0036 | 115.7778 | ±1.0006 | 35.0887 | ±1.0550 | |
| 2.776 | 0.1221 | ±0.0026 | 117.9685 | ±0.7405 | 35.7913 | ±0.7841 | |
| 3.201 | 0.1272 | ±0.0030 | 121.2133 | ±0.8465 | 37.2762 | ±0.8955 | |
| Na2SO4 | 0.088 | 0.1383 | ±0.0036 | 113.3197 | ±1.0194 | 40.5521 | ±1.0765 |
| 0.235 | 0.1600 | ±0.0061 | 120.4811 | ±1.7043 | 46.9052 | ±1.7933 | |
| 0.495 | 0.1175 | ±0.0025 | 107.9805 | ±0.7085 | 34.4392 | ±0.7501 | |
| 0.730 | 0.1648 | ±0.0023 | 122.8768 | ±0.6640 | 48.3184 | ±0.7037 | |
| 0.930 | 0.1407 | ±0.0070 | 117.0263 | ±1.9795 | 41.2489 | ±2.0777 | |
The surface excess enthalpy was calculated for a temperature of 293.15 K. The combined standard uncertainty of the molality values amounts to uc(m) = 0.0002 mol·kg–1. The combined standard uncertainties of the surface excess enthalpy uc(Δhσ) are estimated via error calculation. See Chapter S6 in SI for more detail. The standard uncertainties of the surface excess entropy u(Δsσ) and the surface excess energy u(Δuσ) are taken from least-squares linear regression analysis.
Figure 6
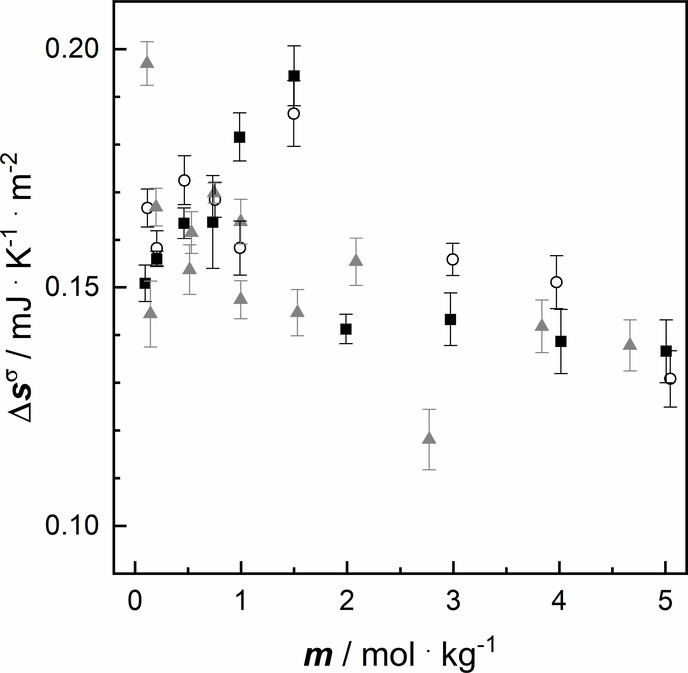
Figure 6. Surface excess entropy of aqueous salt solutions as a function of molality m at a pressure p = 100,000 Pa of: ■ NaCl, ○ NaBr, gray ▲ NaI (cf. Table 6).
Figure 7
Figure 7. Surface excess entropy Δsσ of aqueous salt solutions as a function of molality m at a pressure p = 100,000 Pa of: ■ NaCl (again for comparison), ○ LiCl, gray ▲ KCl (cf. Table 6).
Figure 8
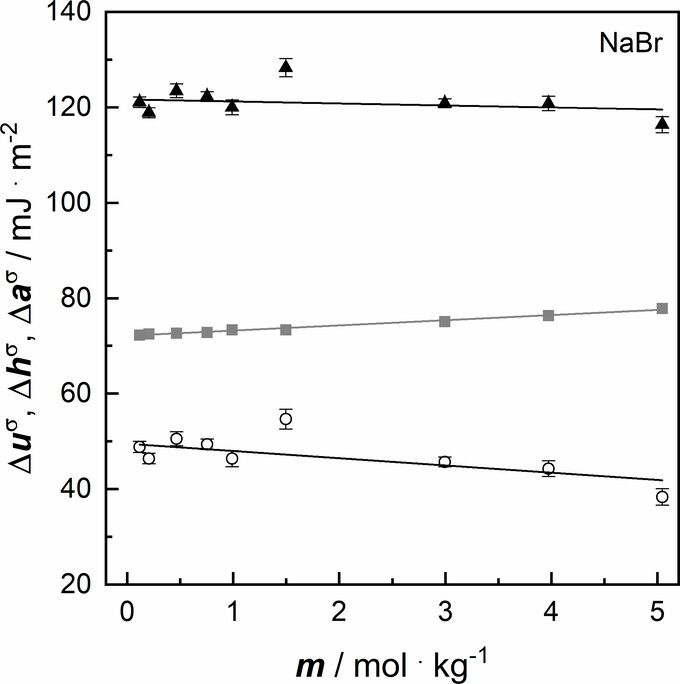
Figure 8. Thermodynamic quantities of aqueous salt solutions of NaBr as a function of molality m and their linear fits at a pressure p = 100,000 Pa: ▲ surface excess energy Δuσ(cf. Table 6), gray ■ surface excess Helmholtz energy Δaσ at T = 293.15 K (cf. Table 3), ○ surface excess enthalpy Δhσ at T = 293.15 K (cf. Table 6). The error bars correspond to the uncertainties of Δuσ and Δhσ given in Table 6. The uncertainties of Δaσ are too small to depict, but they are equal to those of the surface tension given in Table S6 in SI.
4. Conclusions
Supporting Information
The following files are available free of charge. The Supporting Information is available free of charge at https://pubs.acs.org/doi/10.1021/acs.jced.5c00470.
Conversion of mass fraction to molality (Chapter S1, Table S1); solubility of the inorganic salts (Chapter S2, Tables S2 and S3); preparation of LiCl (Chapter S3, Figure S1); estimation of the surface tension from time series (Chapter S4, Figure S2); surface tension of water including uncertainties (Chapter S5, Table S4); calculation of the combined standard uncertainty of the molality (Chapter S6.1, Table S5); calculation of the combined standard uncertainty of the density (Chapter S6.2); calculation of the combined standard uncertainty of the surface tension (Chapter S6.3, Table S6); calculation of the combined standard uncertainty of the excess surface tension (Chapter S6.4); calculation of the combined standard uncertainty of the surface excess enthalpy (Chapter S6.5); density values at 293.15 and 278.15 K (Chapter S7 and Figure S3); surface tension as a function of the temperature of NaCl, NaI, LiCl, KCl, MgCl2, and Na2SO4 solution (Chapter S8 and Figures S4–S9); surface tension as a function of the molality of NaCl, NaI, LiCl, KCl, MgCl2, and Na2SO4 solution (Chapter S9 and Figures S10–S12); thermodynamic quantities such as surface excess energy, surface excess Helmholtz energy, and surface excess enthalpy at 293.15 K of NaCl, NaI, LiCl, KCl, MgCl2, and Na2SO4 solution (Chapter S10 and Figures S13 to S15); excess surface tension including fits for all aqueous inorganic salt solutions at 293.15 K (Chapter S11, Table S7, and Figures S16 and S17); graphical comparison of the density values with literature data (Chapter S12, Figures S18 and S19); graphical comparison of the surface tension values with literature data (Chapter S13, Figures S20 and S21) (PDF)
Terms & Conditions
Most electronic Supporting Information files are available without a subscription to ACS Web Editions. Such files may be downloaded by article for research use (if there is a public use license linked to the relevant article, that license may permit other uses). Permission may be obtained from ACS for other uses through requests via the RightsLink permission system: http://pubs.acs.org/page/copyright/permissions.html.
Author Information
- Manuela Reichelt - Wilhelm-Ostwald-Institut für Physikalische und Theoretische Chemie, Universität Leipzig, Linnéstraße 2, 04103 Leipzig, Germany;
 https://orcid.org/0000-0002-8365-1671;
The manuscript was written through the contributions of all authors. All authors have given approval to the final version of the manuscript. M. R.: Conceptualization, methodology, experiment, investigation, data evaluation, formal analysis, validation, visualization, writing – original draft, and writing – review and editing. A. G.: Experiment, investigation, data evaluation, and writing – review and editing.
The research was funded by the Deutsche Forschungsgemeinschaft (DFG, German Research Foundation) project 321027174 (Spectroscopic Characterization of Salt Dissolution in Microhydrated Cluster Ions and at the Water/Vapor Interface).
Acknowledgments
We thank Prof. Dr. Jonas Warneke for his discussions and critical comments on the manuscript.
References
This article references 65 other publications.
- 1Lelieveld, J.; Crutzen, P. J.; Ramanathan, V.; Andreae, M. O.; Brenninkmeijer, C. M.; Campos, T.; Cass, G. R.; Dickerson, R. R.; Fischer, H.; de Gouw, J. A.; Hansel, A.; Jefferson, A.; Kley, D.; de Laat, A. T.; Lal, S.; Lawrence, M. G.; Lobert, J. M.; Mayol-Bracero, O. L.; Mitra, A. P.; Novakov, T.; Oltmans, S. J.; Prather, K. A.; Reiner, T.; Rodhe, H.; Scheeren, H. A.; Sikka, D.; Williams, J. The Indian Ocean experiment: widespread air pollution from South and Southeast Asia. Science 2001, 291, 1031– 1036, DOI: 10.1126/science.1057103Google ScholarThere is no corresponding record for this reference.
- 2Ramanathan, V.; Crutzen, P. J.; Lelieveld, J.; Mitra, A. P.; Althausen, D.; Anderson, J.; Andreae, M. O.; Cantrell, W.; Cass, G. R.; Chung, C. E.; Clarke, A. D.; Coakley, J. A.; Collins, W. D.; Conant, W. C.; Dulac, F.; Heintzenberg, J.; Heymsfield, A. J.; Holben, B.; Howell, S.; Hudson, J.; Jayaraman, A.; Kiehl, J. T.; Krishnamurti, T. N.; Lubin, D.; McFarquhar, G.; Novakov, T.; Ogren, J. A.; Podgorny, I. A.; Prather, K.; Priestley, K.; Prospero, J. M.; Quinn, P. K.; Rajeev, K.; Rasch, P.; Rupert, S.; Sadourny, R.; Satheesh, S. K.; Shaw, G. E.; Sheridan, P.; Valero, F. P. J. Indian Ocean Experiment: An integrated analysis of the climate forcing and effects of the great Indo-Asian haze. J. Geophys. Res. 2001, 106, 28371– 28398, DOI: 10.1029/2001JD900133Google ScholarThere is no corresponding record for this reference.
- 3Brenninkmeijer, C. A. M.; Slemr, F.; Koeppel, C.; Scharffe, D. S.; Pupek, M.; Lelieveld, J.; Crutzen, P.; Zahn, A.; Sprung, D.; Fischer, H.; Hermann, M.; Reichelt, M.; Heintzenberg, J.; Schlager, H.; Ziereis, H.; Schumann, U.; Dix, B.; Platt, U.; Ebinghaus, R.; Martinsson, B.; Ciais, P.; Filippi, D.; Leuenberger, M.; Oram, D.; Penkett, S.; van Velthoven, P.; Waibel, A. Analyzing atmospheric trace gases and aerosols using passenger aircraft. EOS Trans. Am. Geophys. Union 2005, 86, 77– 83, DOI: 10.1029/2005EO080001Google ScholarThere is no corresponding record for this reference.
- 4Park, S. S.; Bae, M.-S.; Schauer, J. J.; Kim, Y. J.; Yong Cho, S.; Jai Kim, S. Molecular composition of PM2.5 organic aerosol measured at an urban site of Korea during the ACE-Asia campaign. Atmos. Environ. 2006, 40, 4182– 4198, DOI: 10.1016/j.atmosenv.2006.02.012Google ScholarThere is no corresponding record for this reference.
- 5Ansmann, A.; Petzold, A.; Kandler, K.; Tegen, I.; Wendisch, M.; Müller, D.; Weinzierl, B.; Müller, T.; Heintzenberg, J. Saharan Mineral Dust Experiments SAMUM–1 and SAMUM–2: what have we learned?. Tellus B: Chem. Phys. Meteorol. 2011, 63, 403, DOI: 10.1111/j.1600-0889.2011.00555.xGoogle ScholarThere is no corresponding record for this reference.
- 6Kandler, K.; Schütz, L.; Jäckel, S.; Lieke, K.; Emmel, C.; Müller-Ebert, D.; Ebert, M.; Scheuvens, D.; Schladitz, A.; Šegvié, B.; Wiedensohler, A.; Weinbruch, S. Ground-based off-line aerosol measurements at Praia, Cape Verde, during the Saharan Mineral Dust Experiment: microphysical properties and mineralogy. Tellus B: Chem. Phys. Meteorol. 2011, 63, 459, DOI: 10.1111/j.1600-0889.2011.00546.xGoogle ScholarThere is no corresponding record for this reference.
- 7Kandler, K.; Lieke, K.; Benker, N.; Emmel, C.; Küpper, M.; Müller-Ebert, D.; Ebert, M.; Scheuvens, D.; Schladitz, A.; Schütz, L.; Weinbruch, S. Electron microscopy of particles collected at Praia, Cape Verde, during the Saharan Mineral Dust Experiment: particle chemistry, shape, mixing state and complex refractive index. Tellus B: Chem. Phys. Meteorol. 2011, 63, 475, DOI: 10.1111/j.1600-0889.2011.00550.xGoogle ScholarThere is no corresponding record for this reference.
- 8Lieke, K.; Kandler, K.; Scheuvens, D.; Emmel, C.; von Glahn, C.; Petzold, A.; Weinzierl, B.; Veira, A.; Ebert, M.; Weinbruch, S.; Schütz, L. Particle chemical properties in the vertical column based on aircraft observations in the vicinity of Cape Verde Islands. Tellus B: Chem. Phys. Meteorol. 2011, 63, 497, DOI: 10.1111/j.1600-0889.2011.00553.xGoogle ScholarThere is no corresponding record for this reference.
- 9Wendisch, M.; Pöschl, U.; Andreae, M. O.; Machado, L. A. T.; Albrecht, R.; Schlager, H.; Rosenfeld, D.; Martin, S. T.; Abdelmonem, A.; Afchine, A.; Araùjo, A. C.; Artaxo, P.; Aufmhoff, H.; Barbosa, H. M. J.; Borrmann, S.; Braga, R.; Buchholz, B.; Cecchini, M. A.; Costa, A.; Curtius, J.; Dollner, M.; Dorf, M.; Dreiling, V.; Ebert, V.; Ehrlich, A.; Ewald, F.; Fisch, G.; Fix, A.; Frank, F.; Fütterer, D.; Heckl, C.; Heidelberg, F.; Hüneke, T.; Jäkel, E.; Järvinen, E.; Jurkat, T.; Kanter, S.; Kästner, U.; Kenntner, M.; Kesselmeier, J.; Klimach, T.; Knecht, M.; Kohl, R.; Kölling, T.; Krämer, M.; Krüger, M.; Krisna, T. C.; Lavric, J. V.; Longo, K.; Mahnke, C.; Manzi, A. O.; Mayer, B.; Mertes, S.; Minikin, A.; Molleker, S.; Münch, S.; Nillius, B.; Pfeilsticker, K.; Pöhlker, C.; Roiger, A.; Rose, D.; Rosenow, D.; Sauer, D.; Schnaiter, M.; Schneider, J.; Schulz, C.; de Souza, R. A. F.; Spanu, A.; Stock, P.; Vila, D.; Voigt, C.; Walser, A.; Walter, D.; Weigel, R.; Weinzierl, B.; Werner, F.; Yamasoe, M. A.; Ziereis, H.; Zinner, T.; Zöger, M. ACRIDICON–CHUVA Campaign: Studying Tropical Deep Convective Clouds and Precipitation over Amazonia Using the New German Research Aircraft HALO. Bull. Am. Meteorol. Soc. 2016, 97, 1885– 1908, DOI: 10.1175/BAMS-D-14-00255.1Google ScholarThere is no corresponding record for this reference.
- 10Höpfner, M.; Ungermann, J.; Borrmann, S.; Wagner, R.; Spang, R.; Riese, M.; Stiller, G.; Appel, O.; Batenburg, A. M.; Bucci, S.; Cairo, F.; Dragoneas, A.; Friedl-Vallon, F.; Hünig, A.; Johansson, S.; Krasauskas, L.; Legras, B.; Leisner, T.; Mahnke, C.; Möhler, O.; Molleker, S.; Müller, R.; Neubert, T.; Orphal, J.; Preusse, P.; Rex, M.; Saathoff, H.; Stroh, F.; Weigel, R.; Wohltmann, I. Ammonium nitrate particles formed in upper troposphere from ground ammonia sources during Asian monsoons. Nat. Geosci. 2019, 12, 608– 612, DOI: 10.1038/s41561-019-0385-8Google ScholarThere is no corresponding record for this reference.
- 11Gonzalez, M. E.; Corral, A. F.; Crosbie, E.; Dadashazar, H.; Diskin, G. S.; Edwards, E.-L.; Kirschler, S.; Moore, R. H.; Robinson, C. E.; Schlosser, J. S.; Shook, M.; Stahl, C.; Thornhill, K. L.; Voigt, C.; Winstead, E.; Ziemba, L. D.; Sorooshian, A. Relationships between supermicrometer particle concentrations and cloud water sea salt and dust concentrations: analysis of MONARC and ACTIVATE data. Environ. Sci.: Atmos. 2022, 2, 738– 752, DOI: 10.1039/D2EA00049KGoogle ScholarThere is no corresponding record for this reference.
- 12Shupe, M. D.; Rex, M.; Blomquist, B.; Persson, P. O. G.; Schmale, J.; Uttal, T.; Althausen, D.; Angot, H.; Archer, S.; Bariteau, L.; Beck, I.; Bilberry, J.; Bucci, S.; Buck, C.; Boyer, M.; Brasseur, Z.; Brooks, I. M.; Calmer, R.; Cassano, J.; Castro, V.; Chu, D.; Costa, D.; Cox, C. J.; Creamean, J.; Crewell, S.; Dahlke, S.; Damm, E.; de Boer, G.; Deckelmann, H.; Dethloff, K.; Dütsch, M.; Ebell, K.; Ehrlich, A.; Ellis, J.; Engelmann, R.; Fong, A. A.; Frey, M. M.; Gallagher, M. R.; Ganzeveld, L.; Gradinger, R.; Graeser, J.; Greenamyer, V.; Griesche, H.; Griffiths, S.; Hamilton, J.; Heinemann, G.; Helmig, D.; Herber, A.; Heuzé, C.; Hofer, J.; Houchens, T.; Howard, D.; Inoue, J.; Jacobi, H.-W.; Jaiser, R.; Jokinen, T.; Jourdan, O.; Jozef, G.; King, W.; Kirchgaessner, A.; Klingebiel, M.; Krassovski, M.; Krumpen, T.; Lampert, A.; Landing, W.; Laurila, T.; Lawrence, D.; Lonardi, M.; Loose, B.; Lüpkes, C.; Maahn, M.; Macke, A.; Maslowski, W.; Marsay, C.; Maturilli, M.; Mech, M.; Morris, S.; Moser, M.; Nicolaus, M.; Ortega, P.; Osborn, J.; Pätzold, F.; Perovich, D. K.; Petäjä, T.; Pilz, C.; Pirazzini, R.; Posman, K.; Powers, H.; Pratt, K. A.; Preußer, A.; Quéléver, L.; Radenz, M.; Rabe, B.; Rinke, A.; Sachs, T.; Schulz, A.; Siebert, H.; Silva, T.; Solomon, A.; Sommerfeld, A.; Spreen, G.; Stephens, M.; Stohl, A.; Svensson, G.; Uin, J.; Viegas, J.; Voigt, C.; von der Gathen, P.; Wehner, B.; Welker, J. M.; Wendisch, M.; Werner, M.; Xie, Z.; Yue, F. Overview of the MOSAiC expedition: Atmosphere. Elem. Sci. Anth. 2022, 10, 00060 DOI: 10.1525/elementa.2021.00060Google ScholarThere is no corresponding record for this reference.
- 13Finlayson-Pitts, B. J. Reactions at surfaces in the atmosphere: integration of experiments and theory as necessary (but not necessarily sufficient) for predicting the physical chemistry of aerosols. Phys. Chem. Chem. Phys. 2009, 11, 7760– 7779, DOI: 10.1039/b906540gGoogle ScholarThere is no corresponding record for this reference.
- 14Finlayson-Pitts, B. J.; Hemminger, J. C. Physical Chemistry of Airborne Sea Salt Particles and Their Components. J. Phys. Chem. A 2000, 104, 11463– 11477, DOI: 10.1021/jp002968nGoogle ScholarThere is no corresponding record for this reference.
- 15Nozière, B.; Kalberer, M.; Claeys, M.; Allan, J.; D’Anna, B.; Decesari, S.; Finessi, E.; Glasius, M.; Grgić, I.; Hamilton, J. F.; Hoffmann, T.; Iinuma, Y.; Jaoui, M.; Kahnt, A.; Kampf, C. J.; Kourtchev, I.; Maenhaut, W.; Marsden, N.; Saarikoski, S.; Schnelle-Kreis, J.; Surratt, J. D.; Szidat, S.; Szmigielski, R.; Wisthaler, A. The molecular identification of organic compounds in the atmosphere: state of the art and challenges. Chem. Rev. 2015, 115, 3919– 3983, DOI: 10.1021/cr5003485Google ScholarThere is no corresponding record for this reference.
- 16Tabazadeh, A. Organic aggregate formation in aerosols and its impact on the physicochemical properties of atmospheric particles. Atmos. Environ. 2005, 39, 5472– 5480, DOI: 10.1016/j.atmosenv.2005.05.045Google ScholarThere is no corresponding record for this reference.
- 17Andreae, M. O.; Crutzen, P. J. Atmospheric Aerosols: Biogeochemical Sources and Role in Atmospheric Chemistry. Science 1997, 276, 1052– 1058, DOI: 10.1126/science.276.5315.1052Google ScholarThere is no corresponding record for this reference.
- 18Ren, Z. H.; Huang, J.; Luo, Y.; Zheng, Y. C.; Mei, P.; Lai, L.; Chang, Y. L. Micellization behavior of binary mixtures of amino sulfonate amphoteric surfactant with different octylphenol polyoxyethylene ethers in aqueous salt solution: Both cationic and hydrophilic effects. J. Ind. Eng. Chem. 2016, 36, 263– 270, DOI: 10.1016/j.jiec.2016.02.009Google ScholarThere is no corresponding record for this reference.
- 19Calderón, S. M.; Prisle, N. L. Composition dependent density of ternary aqueous solutions of ionic surfactants and salts. J. Atmos. Chem. 2021, 78, 99– 123, DOI: 10.1007/s10874-020-09411-8Google ScholarThere is no corresponding record for this reference.
- 20Qazi, M. J.; Schlegel, S. J.; Backus, E. H. G.; Bonn, M.; Bonn, D.; Shahidzadeh, N. Dynamic Surface Tension of Surfactants in the Presence of High Salt Concentrations. Langmuir 2020, 36, 7956– 7964, DOI: 10.1021/acs.langmuir.0c01211Google ScholarThere is no corresponding record for this reference.
- 21Finlayson-Pitts, B. J. Chlorine atoms as a potential tropospheric oxidant in the marine boundary layer. Res. Chem. Intermed. 1993, 19, 235– 249, DOI: 10.1163/156856793X00091Google ScholarThere is no corresponding record for this reference.
- 22Knipping, E. M.; Lakin, M. J.; Foster, K. L.; Jungwirth, P.; Tobias, D. J.; Gerber, R. B.; Dabdub, D.; Finlayson-Pitts, B. J. Experiments and Simulations of Ion-Enhanced Interfacial Chemistry on Aqueous NaCl Aerosols. Science 2000, 288, 301– 306, DOI: 10.1126/science.288.5464.301Google ScholarThere is no corresponding record for this reference.
- 23Seinfeld, J. H.; Bretherton, C.; Carslaw, K. S.; Coe, H.; DeMott, P. J.; Dunlea, E. J.; Feingold, G.; Ghan, S.; Guenther, A. B.; Kahn, R.; Kraucunas, I.; Kreidenweis, S. M.; Molina, M. J.; Nenes, A.; Penner, J. E.; Prather, K. A.; Ramanathan, V.; Ramaswamy, V.; Rasch, P. J.; Ravishankara, A. R.; Rosenfeld, D.; Stephens, G.; Wood, R. Improving our fundamental understanding of the role of aerosol-cloud interactions in the climate system. Proc. Natl. Acad. Sci. U.S.A. 2016, 113, 5781– 5790, DOI: 10.1073/pnas.1514043113Google ScholarThere is no corresponding record for this reference.
- 24Jungwirth, P.; Tobias, D. J. Molecular Structure of Salt Solutions: A New View of the Interface with Implications for Heterogeneous Atmospheric Chemistry. J. Phys. Chem. B 2001, 105, 10468– 10472, DOI: 10.1021/jp012750gGoogle ScholarThere is no corresponding record for this reference.
- 25Kleinheins, J.; Marcolli, C.; Dutcher, C. S.; Shardt, N. A unified surface tension model for multi-component salt, organic, and surfactant solutions. Phys. Chem. Chem. Phys. 2024, 26, 17521– 17538, DOI: 10.1039/D4CP00678JGoogle ScholarThere is no corresponding record for this reference.
- 26Motomura, K. Thermodynamic studies on adsorption at interfaces. I. General formulation. J. Colloid Interface Sci. 1978, 64, 348– 355, DOI: 10.1016/0021-9797(78)90371-5Google ScholarThere is no corresponding record for this reference.
- 27Motomura, K.; Matubayasi, N.; Aratono, M.; Matuura, R. Thermodynamic studies on adsorption at interfaces. II. One surface-active component system: Tetradecanol at hexane/water interface. J. Colloid Interface Sci. 1978, 64, 356– 361, DOI: 10.1016/0021-9797(78)90372-7Google ScholarThere is no corresponding record for this reference.
- 28Motomura, K.; Aratono, M.; Matubayasi, N.; Matuura, R. Thermodynamic studies on adsorption at interfaces. J. Colloid Interface Sci. 1978, 67, 247– 254, DOI: 10.1016/0021-9797(78)90009-7Google ScholarThere is no corresponding record for this reference.
- 29Motomura, K.; Iwanaga, S.-I.; Hayami, Y.; Uryu, S.; Matuura, R. Thermodynamic studies on adsorption at interfaces. J. Colloid Interface Sci. 1981, 80, 32– 38, DOI: 10.1016/0021-9797(81)90156-9Google ScholarThere is no corresponding record for this reference.
- 30Matubayasi, N.; Matsuo, H.; Yamamoto, K.; Yamaguchi, S.; Matuzawa, A. Thermodynamic Quantities of Surface Formation of Aqueous Electrolyte Solutions. J. Colloid Interface Sci. 1999, 209, 398– 402, DOI: 10.1006/jcis.1998.5928Google ScholarThere is no corresponding record for this reference.
- 31Matubayasi, N.; Yamamoto, K.; Yamaguchi, S.; Matsuo, H.; Ikeda, N. Thermodynamic Quantities of Surface Formation of Aqueous Electrolyte Solutions. J. Colloid Interface Sci. 1999, 214, 101– 105, DOI: 10.1006/jcis.1999.6172Google ScholarThere is no corresponding record for this reference.
- 32Matubayasi, N.; Tsunetomo, K.; Sato, I.; Akizuki, R.; Morishita, T.; Matuzawa, A.; Natsukari, Y. Thermodynamic Quantities of Surface Formation of Aqueous Electrolyte Solutions - IV. Sodium Halides, Anion Mixtures, and Sea Water. J. Colloid Interface Sci. 2001, 243, 444– 456, DOI: 10.1006/jcis.2001.7890Google ScholarThere is no corresponding record for this reference.
- 33Everett, D. H. Manual of Symbols and Terminology for Physicochemical Quantities and Units, Appendix II: Definitions, Terminology and Symbols in Colloid and Surface Chemistry. Pure Appl. Chem. 1972, 31, 577– 638, DOI: 10.1351/pac197231040577Google ScholarThere is no corresponding record for this reference.
- 34Matubayasi, N.; Yamaguchi, S.; Yamamoto, K.; Matsuo, H. Thermodynamic Quantities of Surface Formation of Aqueous Electrolyte Solutions. J. Colloid Interface Sci. 1999, 209, 403– 407, DOI: 10.1006/jcis.1998.5929Google ScholarThere is no corresponding record for this reference.
- 35Johansson, K.; Eriksson, J. C. γ and dγ/dT measurements on aqueous solutions of 1,1-electrolytes. J. Colloid Interface Sci. 1974, 49, 469– 480, DOI: 10.1016/0021-9797(74)90393-2Google ScholarThere is no corresponding record for this reference.
- 36Ozdemir, O.; Karakashev, S. I.; Nguyen, A. V.; Miller, J. D. Adsorption and surface tension analysis of concentrated alkali halide brine solutions. Miner. Eng. 2009, 22, 263– 271, DOI: 10.1016/j.mineng.2008.08.001Google ScholarThere is no corresponding record for this reference.
- 37Aveyard, R.; Saleem, S. M. Interfacial tensions at alkane-aqueous electrolyte interfaces. J. Chem. Soc., Faraday Trans. 1 1976, 72, 1609, DOI: 10.1039/f19767201609Google ScholarThere is no corresponding record for this reference.
- 38Henry, C. L.; Dalton, C. N.; Scruton, L.; Craig, V. S. J. Ion-Specific Coalescence of Bubbles in Mixed Electrolyte Solutions. J. Phys. Chem. C 2007, 111, 1015– 1023, DOI: 10.1021/jp066400bGoogle ScholarThere is no corresponding record for this reference.
- 39Weissenborn, P. K.; Pugh, R. J. Surface Tension and Bubble Coalescence Phenomena of Aqueous Solutions of Electrolytes. Langmuir 1995, 11, 1422– 1426, DOI: 10.1021/la00005a002Google ScholarThere is no corresponding record for this reference.
- 40Weissenborn, P. K.; Pugh, R. J. Surface Tension of Aqueous Solutions of Electrolytes: Relationship with Ion Hydration, Oxygen Solubility, and Bubble Coalescence. J. Colloid Interface Sci. 1996, 184, 550– 563, DOI: 10.1006/jcis.1996.0651Google ScholarThere is no corresponding record for this reference.
- 41Shah, A.-H. A.; Ali, K.; Bilal, S. Surface tension, surface excess concentration, enthalpy and entropy of surface formation of aqueous salt solutions. Colloids Surf. A Physicochem. Eng. Asp. 2013, 417, 183– 190, DOI: 10.1016/j.colsurfa.2012.10.054Google ScholarThere is no corresponding record for this reference.
- 42Horibe, A.; Fukusako, S.; Yamada, M. Surface tension of low-temperature aqueous solutions. Int. J. Thermophys. 1996, 17, 483– 493, DOI: 10.1007/BF01443405Google ScholarThere is no corresponding record for this reference.
- 43Bzdek, B. R.; Reid, J. P.; Malila, J.; Prisle, N. L. The surface tension of surfactant-containing, finite volume droplets. Proc. Natl. Acad. Sci. U.S.A. 2020, 117, 8335– 8343, DOI: 10.1073/pnas.1915660117Google ScholarThere is no corresponding record for this reference.
- 44Apelblat, A.; Manzurola, E. Volumetric properties of aqueous solutions of lithium chloride at temperatures from 278.15 K to 338.15 K and molalities (0.1, 0.5, and 1.0). J. Chem. Thermodyn. 2001, 33, 1133– 1155, DOI: 10.1006/jcht.2001.0826Google ScholarThere is no corresponding record for this reference.
- 45Isono, T. Density, viscosity, and electrolytic conductivity of concentrated aqueous electrolyte solutions at several temperatures. Alkaline-earth chlorides, lanthanum chloride, sodium chloride, sodium nitrate, sodium bromide, potassium nitrate, potassium bromide, and cadmium nitrate. J. Chem. Eng. Data 1984, 29, 45– 52, DOI: 10.1021/je00035a016Google ScholarThere is no corresponding record for this reference.
- 46Apelblat, A.; Manzurola, E. Volumetric properties of water, and solutions of sodium chloride and potassium chloride at temperatures from T = 277.15 K to T = 343.15 K at molalities of (0.1, 0.5, and 1.0)mol·kg–1. J. Chem. Thermodyn. 1999, 31, 869– 893, DOI: 10.1006/jcht.1999.0487Google ScholarThere is no corresponding record for this reference.
- 47Hoffert, U.; André, L.; Blöcher, G.; Guignot, S.; Lassin, A.; Milsch, H.; Sass, I. Density of pure and mixed NaCl and CaCl2 aqueous solutions at 293 K to 353 K and 0.1 MPa: an integrated comparison of analytical and numerical data. Geotherm. Energy 2024, 12, 39, DOI: 10.1186/s40517-024-00318-1Google ScholarThere is no corresponding record for this reference.
- 48Rogers, P. S. Z.; Pitzer, K. S. Volumetric Properties of Aqueous Sodium Chloride Solutions. J. Phys. Chem. Ref. Data 1982, 11, 15– 81, DOI: 10.1063/1.555660Google ScholarThere is no corresponding record for this reference.
- 49Jarvis, N. L.; Scheiman, M. A. Surface potentials of aqueous electrolyte solutions. J. Phys. Chem. 1968, 72, 74– 78, DOI: 10.1021/j100847a014Google ScholarThere is no corresponding record for this reference.
- 50Jones, G.; Ray, W. A. The Surface Tension of Solutions. J. Am. Chem. Soc. 1935, 57, 957– 958, DOI: 10.1021/ja01308a506Google ScholarThere is no corresponding record for this reference.
- 51Jones, G.; Ray, W. A. The Surface Tension of Solutions of Electrolytes as a Function of the Concentration. III. Sodium Chloride. J. Am. Chem. Soc. 1941, 63, 3262– 3263, DOI: 10.1021/ja01857a007Google ScholarThere is no corresponding record for this reference.
- 52Jones, G.; Ray, W. A. The Surface Tension of Solutions of Electrolytes as a Function of the Concentration II *. J. Am. Chem. Soc. 1941, 63, 288– 294, DOI: 10.1021/ja01846a070Google ScholarThere is no corresponding record for this reference.
- 53Uematsu, Y.; Bonthuis, D. J.; Netz, R. R. Charged Surface-Active Impurities at Nanomolar Concentration Induce Jones-Ray Effect. J. Phys. Chem. Lett. 2018, 9, 189– 193, DOI: 10.1021/acs.jpclett.7b02960Google ScholarThere is no corresponding record for this reference.
- 54Okur, H. I.; Chen, Y.; Wilkins, D. M.; Roke, S. The Jones-Ray effect reinterpreted: Surface tension minima of low ionic strength electrolyte solutions are caused by electric field induced water-water correlations. Chem. Phys. Lett. 2017, 684, 433– 442, DOI: 10.1016/j.cplett.2017.06.018Google ScholarThere is no corresponding record for this reference.
- 55Okur, H. I.; Drexler, C. I.; Tyrode, E.; Cremer, P. S.; Roke, S. The Jones-Ray Effect Is Not Caused by Surface-Active Impurities. J. Phys. Chem. Lett. 2018, 9, 6739– 6743, DOI: 10.1021/acs.jpclett.8b02957Google ScholarThere is no corresponding record for this reference.
- 56Pegram, L. M.; Record, M. T. Hofmeister salt effects on surface tension arise from partitioning of anions and cations between bulk water and the air-water interface. J. Phys. Chem. B 2007, 111, 5411– 5417, DOI: 10.1021/jp070245zGoogle ScholarThere is no corresponding record for this reference.
- 57dos Santos, D. J. V. A.; Müller-Plathe, F.; Weiss, V. C. Consistency of Ion Adsorption and Excess Surface Tension in Molecular Dynamics Simulations of Aqueous Salt Solutions. J. Phys. Chem. C 2008, 112, 19431– 19442, DOI: 10.1021/jp804811uGoogle ScholarThere is no corresponding record for this reference.
- 58Boström, M.; Kunz, W.; Ninham, B. W. Hofmeister effects in surface tension of aqueous electrolyte solution. Langmuir 2005, 21, 2619– 2623, DOI: 10.1021/la047437vGoogle ScholarThere is no corresponding record for this reference.
- 59D’Auria, R.; Tobias, D. J. Relation between surface tension and ion adsorption at the air-water interface: a molecular dynamics simulation study. J. Phys. Chem. A 2009, 113, 7286– 7293, DOI: 10.1021/jp810488pGoogle ScholarThere is no corresponding record for this reference.
- 60Sun, L.; Li, X.; Hede, T.; Tu, Y.; Leck, C.; Ågren, H. Molecular dynamics simulations of the surface tension and structure of salt solutions and clusters. J. Phys. Chem. B 2012, 116, 3198– 3204, DOI: 10.1021/jp209178sGoogle ScholarThere is no corresponding record for this reference.
- 61Smith, R. Ion clustering in aqueous salt solutions near the liquid/vapor interface. Condens. Matter Phys. 2016, 19, 23002, DOI: 10.5488/CMP.19.23002Google ScholarThere is no corresponding record for this reference.
- 62Ghosal, S.; Hemminger, J. C.; Bluhm, H.; Mun, B. S.; Hebenstreit, E. L. D.; Ketteler, G.; Ogletree, D. F.; Requejo, F. G.; Salmeron, M. Electron Spectroscopy of Aqueous Solution Interfaces Reveals Surface Enhancement of Halides. Science 2005, 307, 563– 566, DOI: 10.1126/science.1106525Google ScholarThere is no corresponding record for this reference.
- 63Krisch, M. J.; D’Auria, R.; Brown, M. A.; Tobias, D. J.; Hemminger, C.; Ammann, M.; Starr, D. E.; Bluhm, H. The Effect of an Organic Surfactant on the Liquid–Vapor Interface of an Electrolyte Solution. J. Phys. Chem. C 2007, 111, 13497– 13509, DOI: 10.1021/jp073078bGoogle ScholarThere is no corresponding record for this reference.
- 64Onorato, R. M.; Otten, D. E.; Saykally, R. J. Measurement of Bromide Ion Affinities for the Air/Water and Dodecanol/Water Interfaces at Molar Concentrations by UV Second Harmonic Generation Spectroscopy. J. Phys. Chem. C 2010, 114, 13746– 13751, DOI: 10.1021/jp103454rGoogle ScholarThere is no corresponding record for this reference.
- 65Matubayasi, N.; Sugiyama, S.; Kanzaki, M.; Matuzawa, A. Thermodynamic Studies of the Adsorbed Films and Micelles of Sodium Taurodeoxycholate. J. Colloid Interface Sci. 1997, 196, 123– 127, DOI: 10.1006/jcis.1997.5213Google ScholarThere is no corresponding record for this reference.
Cited By
This article has not yet been cited by other publications.

Journal of Chemical & Engineering Data
Copyright © 2025 The Authors. Published by American Chemical Society. This publication is licensed under
License Summary*
You are free to share (copy and redistribute) this article in any medium or format and to adapt (remix, transform, and build upon) the material for any purpose, even commercially within the parameters below:
Creative Commons (CC): This is a Creative Commons license.
Attribution (BY): Credit must be given to the creator.
*Disclaimer
This summary highlights only some of the key features and terms of the actual license. It is not a license and has no legal value. Carefully review the actual license before using these materials.
Article Views
Altmetric
Citations
Article Views are the COUNTER-compliant sum of full text article downloads since November 2008 (both PDF and HTML) across all institutions and individuals. These metrics are regularly updated to reflect usage leading up to the last few days.
Citations are the number of other articles citing this article, calculated by Crossref and updated daily. Find more information about Crossref citation counts.
The Altmetric Attention Score is a quantitative measure of the attention that a research article has received online. Clicking on the donut icon will load a page at altmetric.com with additional details about the score and the social media presence for the given article. Find more information on the Altmetric Attention Score and how the score is calculated.
Recommended Articles
Abstract
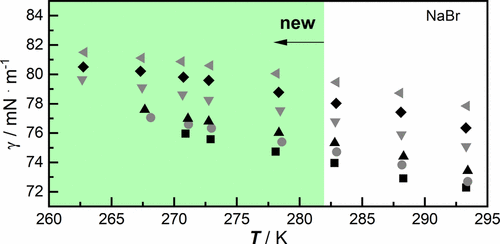
Figure 1
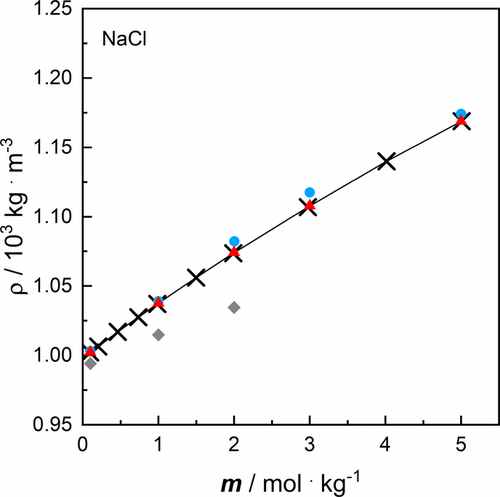
Figure 1. Density ρ of aqueous salt solutions of NaCl as a function of molality m at a temperature T = 293.15 K and at a pressure p = 100,000 Pa for: solid line and × own data (cf. Table 2) in comparison with data from literature: blue ● Hoffert et al., (47) red ▲ Rogers and Pitzer, (48) and gray ◆ Shah et al. (41) Note that the reference data from Rogers and Pitzer are given as specific volumes and were converted into density for comparison.
Figure 2
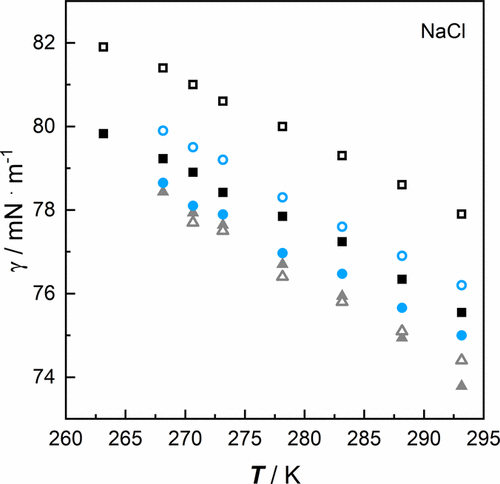
Figure 2. Surface tension γ of aqueous salt solutions of NaCl as a function of temperature T at a pressure p = 100,000 Pa for own data at: ■ 2.994 mol·kg–1, blue ● 1.997 mol·kg–1, gray ▲ 0.984 mol·kg–1 (cf. Table 3) and data from literature (42) at: □ 3.020 mol·kg–1, blue ○ 1.901 mol·kg–1, gray △ 0.901 mol·kg–1. The concentrations of the reference data are given in mass fractions and were converted into molality for comparison (cf. Chapter S1 in the SI).
Figure 3

Figure 3. Surface tension γ of aqueous salt solutions of NaBr as a function of temperature T at a pressure p = 100,000 Pa: ■ 0.116 mol·kg–1, gray ● 0.464 mol·kg–1, ▲ 0.988 mol·kg–1, gray ▼ 2.994 mol·kg–1, ◆ 3.971 mol·kg–1, gray ◀ 5.046 mol·kg–1 (cf. Table 3).
Figure 4
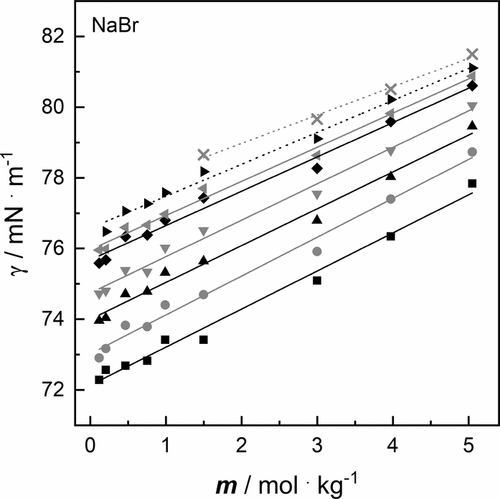
Figure 4. Surface tension γ of aqueous salt solutions of NaBr as a function of molality m at a pressure p = 100,000 Pa: Solid and dotted lines result from linear fit at ■ 293.15 K, gray ● 288.15 K, ▲ 283.15 K, gray ▼ 278.15 K, ◆ 273.15 K, gray ◀ 271.15 K, ▶ 268.15 K, gray × 263.15 K (cf. Table 3).
Figure 5
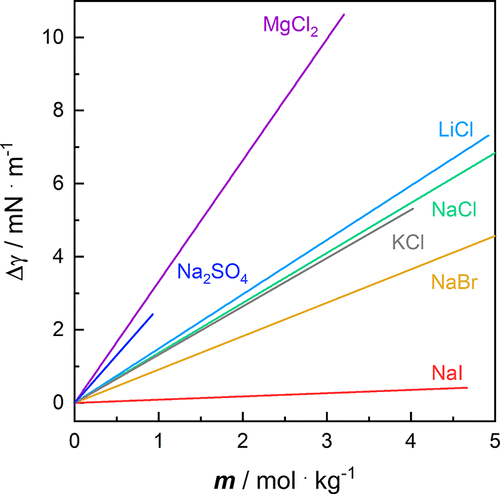
Figure 5. Linear fit results of the excess surface tension Δγ of aqueous salt solutions as a function of molality m at a temperature T = 293.15 K and a pressure p = 100,000 Pa of green ─ NaCl, orange ─ NaBr, red ─ NaI, sky blue ─ LiCl, gray ─ KCl, purple ─ MgCl2, and blue ─ Na2SO4. (cf. Figures S16 and S17). See Chapter 10 in the SI for more information on fitting the experimental data.
Figure 6
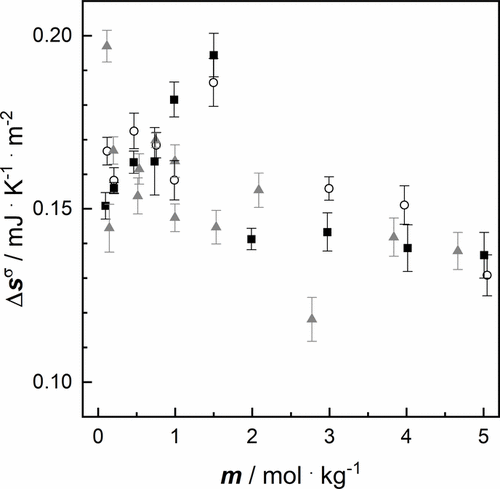
Figure 6. Surface excess entropy of aqueous salt solutions as a function of molality m at a pressure p = 100,000 Pa of: ■ NaCl, ○ NaBr, gray ▲ NaI (cf. Table 6).
Figure 7
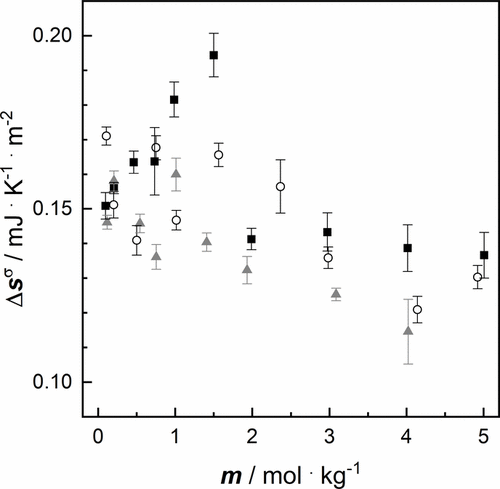
Figure 7. Surface excess entropy Δsσ of aqueous salt solutions as a function of molality m at a pressure p = 100,000 Pa of: ■ NaCl (again for comparison), ○ LiCl, gray ▲ KCl (cf. Table 6).
Figure 8
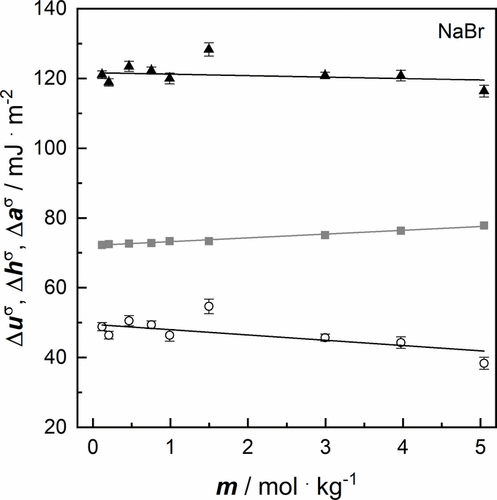
Figure 8. Thermodynamic quantities of aqueous salt solutions of NaBr as a function of molality m and their linear fits at a pressure p = 100,000 Pa: ▲ surface excess energy Δuσ(cf. Table 6), gray ■ surface excess Helmholtz energy Δaσ at T = 293.15 K (cf. Table 3), ○ surface excess enthalpy Δhσ at T = 293.15 K (cf. Table 6). The error bars correspond to the uncertainties of Δuσ and Δhσ given in Table 6. The uncertainties of Δaσ are too small to depict, but they are equal to those of the surface tension given in Table S6 in SI.
References
This article references 65 other publications.
- 1Lelieveld, J.; Crutzen, P. J.; Ramanathan, V.; Andreae, M. O.; Brenninkmeijer, C. M.; Campos, T.; Cass, G. R.; Dickerson, R. R.; Fischer, H.; de Gouw, J. A.; Hansel, A.; Jefferson, A.; Kley, D.; de Laat, A. T.; Lal, S.; Lawrence, M. G.; Lobert, J. M.; Mayol-Bracero, O. L.; Mitra, A. P.; Novakov, T.; Oltmans, S. J.; Prather, K. A.; Reiner, T.; Rodhe, H.; Scheeren, H. A.; Sikka, D.; Williams, J. The Indian Ocean experiment: widespread air pollution from South and Southeast Asia. Science 2001, 291, 1031– 1036, DOI: 10.1126/science.1057103There is no corresponding record for this reference.
- 2Ramanathan, V.; Crutzen, P. J.; Lelieveld, J.; Mitra, A. P.; Althausen, D.; Anderson, J.; Andreae, M. O.; Cantrell, W.; Cass, G. R.; Chung, C. E.; Clarke, A. D.; Coakley, J. A.; Collins, W. D.; Conant, W. C.; Dulac, F.; Heintzenberg, J.; Heymsfield, A. J.; Holben, B.; Howell, S.; Hudson, J.; Jayaraman, A.; Kiehl, J. T.; Krishnamurti, T. N.; Lubin, D.; McFarquhar, G.; Novakov, T.; Ogren, J. A.; Podgorny, I. A.; Prather, K.; Priestley, K.; Prospero, J. M.; Quinn, P. K.; Rajeev, K.; Rasch, P.; Rupert, S.; Sadourny, R.; Satheesh, S. K.; Shaw, G. E.; Sheridan, P.; Valero, F. P. J. Indian Ocean Experiment: An integrated analysis of the climate forcing and effects of the great Indo-Asian haze. J. Geophys. Res. 2001, 106, 28371– 28398, DOI: 10.1029/2001JD900133There is no corresponding record for this reference.
- 3Brenninkmeijer, C. A. M.; Slemr, F.; Koeppel, C.; Scharffe, D. S.; Pupek, M.; Lelieveld, J.; Crutzen, P.; Zahn, A.; Sprung, D.; Fischer, H.; Hermann, M.; Reichelt, M.; Heintzenberg, J.; Schlager, H.; Ziereis, H.; Schumann, U.; Dix, B.; Platt, U.; Ebinghaus, R.; Martinsson, B.; Ciais, P.; Filippi, D.; Leuenberger, M.; Oram, D.; Penkett, S.; van Velthoven, P.; Waibel, A. Analyzing atmospheric trace gases and aerosols using passenger aircraft. EOS Trans. Am. Geophys. Union 2005, 86, 77– 83, DOI: 10.1029/2005EO080001There is no corresponding record for this reference.
- 4Park, S. S.; Bae, M.-S.; Schauer, J. J.; Kim, Y. J.; Yong Cho, S.; Jai Kim, S. Molecular composition of PM2.5 organic aerosol measured at an urban site of Korea during the ACE-Asia campaign. Atmos. Environ. 2006, 40, 4182– 4198, DOI: 10.1016/j.atmosenv.2006.02.012There is no corresponding record for this reference.
- 5Ansmann, A.; Petzold, A.; Kandler, K.; Tegen, I.; Wendisch, M.; Müller, D.; Weinzierl, B.; Müller, T.; Heintzenberg, J. Saharan Mineral Dust Experiments SAMUM–1 and SAMUM–2: what have we learned?. Tellus B: Chem. Phys. Meteorol. 2011, 63, 403, DOI: 10.1111/j.1600-0889.2011.00555.xThere is no corresponding record for this reference.
- 6Kandler, K.; Schütz, L.; Jäckel, S.; Lieke, K.; Emmel, C.; Müller-Ebert, D.; Ebert, M.; Scheuvens, D.; Schladitz, A.; Šegvié, B.; Wiedensohler, A.; Weinbruch, S. Ground-based off-line aerosol measurements at Praia, Cape Verde, during the Saharan Mineral Dust Experiment: microphysical properties and mineralogy. Tellus B: Chem. Phys. Meteorol. 2011, 63, 459, DOI: 10.1111/j.1600-0889.2011.00546.xThere is no corresponding record for this reference.
- 7Kandler, K.; Lieke, K.; Benker, N.; Emmel, C.; Küpper, M.; Müller-Ebert, D.; Ebert, M.; Scheuvens, D.; Schladitz, A.; Schütz, L.; Weinbruch, S. Electron microscopy of particles collected at Praia, Cape Verde, during the Saharan Mineral Dust Experiment: particle chemistry, shape, mixing state and complex refractive index. Tellus B: Chem. Phys. Meteorol. 2011, 63, 475, DOI: 10.1111/j.1600-0889.2011.00550.xThere is no corresponding record for this reference.
- 8Lieke, K.; Kandler, K.; Scheuvens, D.; Emmel, C.; von Glahn, C.; Petzold, A.; Weinzierl, B.; Veira, A.; Ebert, M.; Weinbruch, S.; Schütz, L. Particle chemical properties in the vertical column based on aircraft observations in the vicinity of Cape Verde Islands. Tellus B: Chem. Phys. Meteorol. 2011, 63, 497, DOI: 10.1111/j.1600-0889.2011.00553.xThere is no corresponding record for this reference.
- 9Wendisch, M.; Pöschl, U.; Andreae, M. O.; Machado, L. A. T.; Albrecht, R.; Schlager, H.; Rosenfeld, D.; Martin, S. T.; Abdelmonem, A.; Afchine, A.; Araùjo, A. C.; Artaxo, P.; Aufmhoff, H.; Barbosa, H. M. J.; Borrmann, S.; Braga, R.; Buchholz, B.; Cecchini, M. A.; Costa, A.; Curtius, J.; Dollner, M.; Dorf, M.; Dreiling, V.; Ebert, V.; Ehrlich, A.; Ewald, F.; Fisch, G.; Fix, A.; Frank, F.; Fütterer, D.; Heckl, C.; Heidelberg, F.; Hüneke, T.; Jäkel, E.; Järvinen, E.; Jurkat, T.; Kanter, S.; Kästner, U.; Kenntner, M.; Kesselmeier, J.; Klimach, T.; Knecht, M.; Kohl, R.; Kölling, T.; Krämer, M.; Krüger, M.; Krisna, T. C.; Lavric, J. V.; Longo, K.; Mahnke, C.; Manzi, A. O.; Mayer, B.; Mertes, S.; Minikin, A.; Molleker, S.; Münch, S.; Nillius, B.; Pfeilsticker, K.; Pöhlker, C.; Roiger, A.; Rose, D.; Rosenow, D.; Sauer, D.; Schnaiter, M.; Schneider, J.; Schulz, C.; de Souza, R. A. F.; Spanu, A.; Stock, P.; Vila, D.; Voigt, C.; Walser, A.; Walter, D.; Weigel, R.; Weinzierl, B.; Werner, F.; Yamasoe, M. A.; Ziereis, H.; Zinner, T.; Zöger, M. ACRIDICON–CHUVA Campaign: Studying Tropical Deep Convective Clouds and Precipitation over Amazonia Using the New German Research Aircraft HALO. Bull. Am. Meteorol. Soc. 2016, 97, 1885– 1908, DOI: 10.1175/BAMS-D-14-00255.1There is no corresponding record for this reference.
- 10Höpfner, M.; Ungermann, J.; Borrmann, S.; Wagner, R.; Spang, R.; Riese, M.; Stiller, G.; Appel, O.; Batenburg, A. M.; Bucci, S.; Cairo, F.; Dragoneas, A.; Friedl-Vallon, F.; Hünig, A.; Johansson, S.; Krasauskas, L.; Legras, B.; Leisner, T.; Mahnke, C.; Möhler, O.; Molleker, S.; Müller, R.; Neubert, T.; Orphal, J.; Preusse, P.; Rex, M.; Saathoff, H.; Stroh, F.; Weigel, R.; Wohltmann, I. Ammonium nitrate particles formed in upper troposphere from ground ammonia sources during Asian monsoons. Nat. Geosci. 2019, 12, 608– 612, DOI: 10.1038/s41561-019-0385-8There is no corresponding record for this reference.
- 11Gonzalez, M. E.; Corral, A. F.; Crosbie, E.; Dadashazar, H.; Diskin, G. S.; Edwards, E.-L.; Kirschler, S.; Moore, R. H.; Robinson, C. E.; Schlosser, J. S.; Shook, M.; Stahl, C.; Thornhill, K. L.; Voigt, C.; Winstead, E.; Ziemba, L. D.; Sorooshian, A. Relationships between supermicrometer particle concentrations and cloud water sea salt and dust concentrations: analysis of MONARC and ACTIVATE data. Environ. Sci.: Atmos. 2022, 2, 738– 752, DOI: 10.1039/D2EA00049KThere is no corresponding record for this reference.
- 12Shupe, M. D.; Rex, M.; Blomquist, B.; Persson, P. O. G.; Schmale, J.; Uttal, T.; Althausen, D.; Angot, H.; Archer, S.; Bariteau, L.; Beck, I.; Bilberry, J.; Bucci, S.; Buck, C.; Boyer, M.; Brasseur, Z.; Brooks, I. M.; Calmer, R.; Cassano, J.; Castro, V.; Chu, D.; Costa, D.; Cox, C. J.; Creamean, J.; Crewell, S.; Dahlke, S.; Damm, E.; de Boer, G.; Deckelmann, H.; Dethloff, K.; Dütsch, M.; Ebell, K.; Ehrlich, A.; Ellis, J.; Engelmann, R.; Fong, A. A.; Frey, M. M.; Gallagher, M. R.; Ganzeveld, L.; Gradinger, R.; Graeser, J.; Greenamyer, V.; Griesche, H.; Griffiths, S.; Hamilton, J.; Heinemann, G.; Helmig, D.; Herber, A.; Heuzé, C.; Hofer, J.; Houchens, T.; Howard, D.; Inoue, J.; Jacobi, H.-W.; Jaiser, R.; Jokinen, T.; Jourdan, O.; Jozef, G.; King, W.; Kirchgaessner, A.; Klingebiel, M.; Krassovski, M.; Krumpen, T.; Lampert, A.; Landing, W.; Laurila, T.; Lawrence, D.; Lonardi, M.; Loose, B.; Lüpkes, C.; Maahn, M.; Macke, A.; Maslowski, W.; Marsay, C.; Maturilli, M.; Mech, M.; Morris, S.; Moser, M.; Nicolaus, M.; Ortega, P.; Osborn, J.; Pätzold, F.; Perovich, D. K.; Petäjä, T.; Pilz, C.; Pirazzini, R.; Posman, K.; Powers, H.; Pratt, K. A.; Preußer, A.; Quéléver, L.; Radenz, M.; Rabe, B.; Rinke, A.; Sachs, T.; Schulz, A.; Siebert, H.; Silva, T.; Solomon, A.; Sommerfeld, A.; Spreen, G.; Stephens, M.; Stohl, A.; Svensson, G.; Uin, J.; Viegas, J.; Voigt, C.; von der Gathen, P.; Wehner, B.; Welker, J. M.; Wendisch, M.; Werner, M.; Xie, Z.; Yue, F. Overview of the MOSAiC expedition: Atmosphere. Elem. Sci. Anth. 2022, 10, 00060 DOI: 10.1525/elementa.2021.00060There is no corresponding record for this reference.
- 13Finlayson-Pitts, B. J. Reactions at surfaces in the atmosphere: integration of experiments and theory as necessary (but not necessarily sufficient) for predicting the physical chemistry of aerosols. Phys. Chem. Chem. Phys. 2009, 11, 7760– 7779, DOI: 10.1039/b906540gThere is no corresponding record for this reference.
- 14Finlayson-Pitts, B. J.; Hemminger, J. C. Physical Chemistry of Airborne Sea Salt Particles and Their Components. J. Phys. Chem. A 2000, 104, 11463– 11477, DOI: 10.1021/jp002968nThere is no corresponding record for this reference.
- 15Nozière, B.; Kalberer, M.; Claeys, M.; Allan, J.; D’Anna, B.; Decesari, S.; Finessi, E.; Glasius, M.; Grgić, I.; Hamilton, J. F.; Hoffmann, T.; Iinuma, Y.; Jaoui, M.; Kahnt, A.; Kampf, C. J.; Kourtchev, I.; Maenhaut, W.; Marsden, N.; Saarikoski, S.; Schnelle-Kreis, J.; Surratt, J. D.; Szidat, S.; Szmigielski, R.; Wisthaler, A. The molecular identification of organic compounds in the atmosphere: state of the art and challenges. Chem. Rev. 2015, 115, 3919– 3983, DOI: 10.1021/cr5003485There is no corresponding record for this reference.
- 16Tabazadeh, A. Organic aggregate formation in aerosols and its impact on the physicochemical properties of atmospheric particles. Atmos. Environ. 2005, 39, 5472– 5480, DOI: 10.1016/j.atmosenv.2005.05.045There is no corresponding record for this reference.
- 17Andreae, M. O.; Crutzen, P. J. Atmospheric Aerosols: Biogeochemical Sources and Role in Atmospheric Chemistry. Science 1997, 276, 1052– 1058, DOI: 10.1126/science.276.5315.1052There is no corresponding record for this reference.
- 18Ren, Z. H.; Huang, J.; Luo, Y.; Zheng, Y. C.; Mei, P.; Lai, L.; Chang, Y. L. Micellization behavior of binary mixtures of amino sulfonate amphoteric surfactant with different octylphenol polyoxyethylene ethers in aqueous salt solution: Both cationic and hydrophilic effects. J. Ind. Eng. Chem. 2016, 36, 263– 270, DOI: 10.1016/j.jiec.2016.02.009There is no corresponding record for this reference.
- 19Calderón, S. M.; Prisle, N. L. Composition dependent density of ternary aqueous solutions of ionic surfactants and salts. J. Atmos. Chem. 2021, 78, 99– 123, DOI: 10.1007/s10874-020-09411-8There is no corresponding record for this reference.
- 20Qazi, M. J.; Schlegel, S. J.; Backus, E. H. G.; Bonn, M.; Bonn, D.; Shahidzadeh, N. Dynamic Surface Tension of Surfactants in the Presence of High Salt Concentrations. Langmuir 2020, 36, 7956– 7964, DOI: 10.1021/acs.langmuir.0c01211There is no corresponding record for this reference.
- 21Finlayson-Pitts, B. J. Chlorine atoms as a potential tropospheric oxidant in the marine boundary layer. Res. Chem. Intermed. 1993, 19, 235– 249, DOI: 10.1163/156856793X00091There is no corresponding record for this reference.
- 22Knipping, E. M.; Lakin, M. J.; Foster, K. L.; Jungwirth, P.; Tobias, D. J.; Gerber, R. B.; Dabdub, D.; Finlayson-Pitts, B. J. Experiments and Simulations of Ion-Enhanced Interfacial Chemistry on Aqueous NaCl Aerosols. Science 2000, 288, 301– 306, DOI: 10.1126/science.288.5464.301There is no corresponding record for this reference.
- 23Seinfeld, J. H.; Bretherton, C.; Carslaw, K. S.; Coe, H.; DeMott, P. J.; Dunlea, E. J.; Feingold, G.; Ghan, S.; Guenther, A. B.; Kahn, R.; Kraucunas, I.; Kreidenweis, S. M.; Molina, M. J.; Nenes, A.; Penner, J. E.; Prather, K. A.; Ramanathan, V.; Ramaswamy, V.; Rasch, P. J.; Ravishankara, A. R.; Rosenfeld, D.; Stephens, G.; Wood, R. Improving our fundamental understanding of the role of aerosol-cloud interactions in the climate system. Proc. Natl. Acad. Sci. U.S.A. 2016, 113, 5781– 5790, DOI: 10.1073/pnas.1514043113There is no corresponding record for this reference.
- 24Jungwirth, P.; Tobias, D. J. Molecular Structure of Salt Solutions: A New View of the Interface with Implications for Heterogeneous Atmospheric Chemistry. J. Phys. Chem. B 2001, 105, 10468– 10472, DOI: 10.1021/jp012750gThere is no corresponding record for this reference.
- 25Kleinheins, J.; Marcolli, C.; Dutcher, C. S.; Shardt, N. A unified surface tension model for multi-component salt, organic, and surfactant solutions. Phys. Chem. Chem. Phys. 2024, 26, 17521– 17538, DOI: 10.1039/D4CP00678JThere is no corresponding record for this reference.
- 26Motomura, K. Thermodynamic studies on adsorption at interfaces. I. General formulation. J. Colloid Interface Sci. 1978, 64, 348– 355, DOI: 10.1016/0021-9797(78)90371-5There is no corresponding record for this reference.
- 27Motomura, K.; Matubayasi, N.; Aratono, M.; Matuura, R. Thermodynamic studies on adsorption at interfaces. II. One surface-active component system: Tetradecanol at hexane/water interface. J. Colloid Interface Sci. 1978, 64, 356– 361, DOI: 10.1016/0021-9797(78)90372-7There is no corresponding record for this reference.
- 28Motomura, K.; Aratono, M.; Matubayasi, N.; Matuura, R. Thermodynamic studies on adsorption at interfaces. J. Colloid Interface Sci. 1978, 67, 247– 254, DOI: 10.1016/0021-9797(78)90009-7There is no corresponding record for this reference.
- 29Motomura, K.; Iwanaga, S.-I.; Hayami, Y.; Uryu, S.; Matuura, R. Thermodynamic studies on adsorption at interfaces. J. Colloid Interface Sci. 1981, 80, 32– 38, DOI: 10.1016/0021-9797(81)90156-9There is no corresponding record for this reference.
- 30Matubayasi, N.; Matsuo, H.; Yamamoto, K.; Yamaguchi, S.; Matuzawa, A. Thermodynamic Quantities of Surface Formation of Aqueous Electrolyte Solutions. J. Colloid Interface Sci. 1999, 209, 398– 402, DOI: 10.1006/jcis.1998.5928There is no corresponding record for this reference.
- 31Matubayasi, N.; Yamamoto, K.; Yamaguchi, S.; Matsuo, H.; Ikeda, N. Thermodynamic Quantities of Surface Formation of Aqueous Electrolyte Solutions. J. Colloid Interface Sci. 1999, 214, 101– 105, DOI: 10.1006/jcis.1999.6172There is no corresponding record for this reference.
- 32Matubayasi, N.; Tsunetomo, K.; Sato, I.; Akizuki, R.; Morishita, T.; Matuzawa, A.; Natsukari, Y. Thermodynamic Quantities of Surface Formation of Aqueous Electrolyte Solutions - IV. Sodium Halides, Anion Mixtures, and Sea Water. J. Colloid Interface Sci. 2001, 243, 444– 456, DOI: 10.1006/jcis.2001.7890There is no corresponding record for this reference.
- 33Everett, D. H. Manual of Symbols and Terminology for Physicochemical Quantities and Units, Appendix II: Definitions, Terminology and Symbols in Colloid and Surface Chemistry. Pure Appl. Chem. 1972, 31, 577– 638, DOI: 10.1351/pac197231040577There is no corresponding record for this reference.
- 34Matubayasi, N.; Yamaguchi, S.; Yamamoto, K.; Matsuo, H. Thermodynamic Quantities of Surface Formation of Aqueous Electrolyte Solutions. J. Colloid Interface Sci. 1999, 209, 403– 407, DOI: 10.1006/jcis.1998.5929There is no corresponding record for this reference.
- 35Johansson, K.; Eriksson, J. C. γ and dγ/dT measurements on aqueous solutions of 1,1-electrolytes. J. Colloid Interface Sci. 1974, 49, 469– 480, DOI: 10.1016/0021-9797(74)90393-2There is no corresponding record for this reference.
- 36Ozdemir, O.; Karakashev, S. I.; Nguyen, A. V.; Miller, J. D. Adsorption and surface tension analysis of concentrated alkali halide brine solutions. Miner. Eng. 2009, 22, 263– 271, DOI: 10.1016/j.mineng.2008.08.001There is no corresponding record for this reference.
- 37Aveyard, R.; Saleem, S. M. Interfacial tensions at alkane-aqueous electrolyte interfaces. J. Chem. Soc., Faraday Trans. 1 1976, 72, 1609, DOI: 10.1039/f19767201609There is no corresponding record for this reference.
- 38Henry, C. L.; Dalton, C. N.; Scruton, L.; Craig, V. S. J. Ion-Specific Coalescence of Bubbles in Mixed Electrolyte Solutions. J. Phys. Chem. C 2007, 111, 1015– 1023, DOI: 10.1021/jp066400bThere is no corresponding record for this reference.
- 39Weissenborn, P. K.; Pugh, R. J. Surface Tension and Bubble Coalescence Phenomena of Aqueous Solutions of Electrolytes. Langmuir 1995, 11, 1422– 1426, DOI: 10.1021/la00005a002There is no corresponding record for this reference.
- 40Weissenborn, P. K.; Pugh, R. J. Surface Tension of Aqueous Solutions of Electrolytes: Relationship with Ion Hydration, Oxygen Solubility, and Bubble Coalescence. J. Colloid Interface Sci. 1996, 184, 550– 563, DOI: 10.1006/jcis.1996.0651There is no corresponding record for this reference.
- 41Shah, A.-H. A.; Ali, K.; Bilal, S. Surface tension, surface excess concentration, enthalpy and entropy of surface formation of aqueous salt solutions. Colloids Surf. A Physicochem. Eng. Asp. 2013, 417, 183– 190, DOI: 10.1016/j.colsurfa.2012.10.054There is no corresponding record for this reference.
- 42Horibe, A.; Fukusako, S.; Yamada, M. Surface tension of low-temperature aqueous solutions. Int. J. Thermophys. 1996, 17, 483– 493, DOI: 10.1007/BF01443405There is no corresponding record for this reference.
- 43Bzdek, B. R.; Reid, J. P.; Malila, J.; Prisle, N. L. The surface tension of surfactant-containing, finite volume droplets. Proc. Natl. Acad. Sci. U.S.A. 2020, 117, 8335– 8343, DOI: 10.1073/pnas.1915660117There is no corresponding record for this reference.
- 44Apelblat, A.; Manzurola, E. Volumetric properties of aqueous solutions of lithium chloride at temperatures from 278.15 K to 338.15 K and molalities (0.1, 0.5, and 1.0). J. Chem. Thermodyn. 2001, 33, 1133– 1155, DOI: 10.1006/jcht.2001.0826There is no corresponding record for this reference.
- 45Isono, T. Density, viscosity, and electrolytic conductivity of concentrated aqueous electrolyte solutions at several temperatures. Alkaline-earth chlorides, lanthanum chloride, sodium chloride, sodium nitrate, sodium bromide, potassium nitrate, potassium bromide, and cadmium nitrate. J. Chem. Eng. Data 1984, 29, 45– 52, DOI: 10.1021/je00035a016There is no corresponding record for this reference.
- 46Apelblat, A.; Manzurola, E. Volumetric properties of water, and solutions of sodium chloride and potassium chloride at temperatures from T = 277.15 K to T = 343.15 K at molalities of (0.1, 0.5, and 1.0)mol·kg–1. J. Chem. Thermodyn. 1999, 31, 869– 893, DOI: 10.1006/jcht.1999.0487There is no corresponding record for this reference.
- 47Hoffert, U.; André, L.; Blöcher, G.; Guignot, S.; Lassin, A.; Milsch, H.; Sass, I. Density of pure and mixed NaCl and CaCl2 aqueous solutions at 293 K to 353 K and 0.1 MPa: an integrated comparison of analytical and numerical data. Geotherm. Energy 2024, 12, 39, DOI: 10.1186/s40517-024-00318-1There is no corresponding record for this reference.
- 48Rogers, P. S. Z.; Pitzer, K. S. Volumetric Properties of Aqueous Sodium Chloride Solutions. J. Phys. Chem. Ref. Data 1982, 11, 15– 81, DOI: 10.1063/1.555660There is no corresponding record for this reference.
- 49Jarvis, N. L.; Scheiman, M. A. Surface potentials of aqueous electrolyte solutions. J. Phys. Chem. 1968, 72, 74– 78, DOI: 10.1021/j100847a014There is no corresponding record for this reference.
- 50Jones, G.; Ray, W. A. The Surface Tension of Solutions. J. Am. Chem. Soc. 1935, 57, 957– 958, DOI: 10.1021/ja01308a506There is no corresponding record for this reference.
- 51Jones, G.; Ray, W. A. The Surface Tension of Solutions of Electrolytes as a Function of the Concentration. III. Sodium Chloride. J. Am. Chem. Soc. 1941, 63, 3262– 3263, DOI: 10.1021/ja01857a007There is no corresponding record for this reference.
- 52Jones, G.; Ray, W. A. The Surface Tension of Solutions of Electrolytes as a Function of the Concentration II *. J. Am. Chem. Soc. 1941, 63, 288– 294, DOI: 10.1021/ja01846a070There is no corresponding record for this reference.
- 53Uematsu, Y.; Bonthuis, D. J.; Netz, R. R. Charged Surface-Active Impurities at Nanomolar Concentration Induce Jones-Ray Effect. J. Phys. Chem. Lett. 2018, 9, 189– 193, DOI: 10.1021/acs.jpclett.7b02960There is no corresponding record for this reference.
- 54Okur, H. I.; Chen, Y.; Wilkins, D. M.; Roke, S. The Jones-Ray effect reinterpreted: Surface tension minima of low ionic strength electrolyte solutions are caused by electric field induced water-water correlations. Chem. Phys. Lett. 2017, 684, 433– 442, DOI: 10.1016/j.cplett.2017.06.018There is no corresponding record for this reference.
- 55Okur, H. I.; Drexler, C. I.; Tyrode, E.; Cremer, P. S.; Roke, S. The Jones-Ray Effect Is Not Caused by Surface-Active Impurities. J. Phys. Chem. Lett. 2018, 9, 6739– 6743, DOI: 10.1021/acs.jpclett.8b02957There is no corresponding record for this reference.
- 56Pegram, L. M.; Record, M. T. Hofmeister salt effects on surface tension arise from partitioning of anions and cations between bulk water and the air-water interface. J. Phys. Chem. B 2007, 111, 5411– 5417, DOI: 10.1021/jp070245zThere is no corresponding record for this reference.
- 57dos Santos, D. J. V. A.; Müller-Plathe, F.; Weiss, V. C. Consistency of Ion Adsorption and Excess Surface Tension in Molecular Dynamics Simulations of Aqueous Salt Solutions. J. Phys. Chem. C 2008, 112, 19431– 19442, DOI: 10.1021/jp804811uThere is no corresponding record for this reference.
- 58Boström, M.; Kunz, W.; Ninham, B. W. Hofmeister effects in surface tension of aqueous electrolyte solution. Langmuir 2005, 21, 2619– 2623, DOI: 10.1021/la047437vThere is no corresponding record for this reference.
- 59D’Auria, R.; Tobias, D. J. Relation between surface tension and ion adsorption at the air-water interface: a molecular dynamics simulation study. J. Phys. Chem. A 2009, 113, 7286– 7293, DOI: 10.1021/jp810488pThere is no corresponding record for this reference.
- 60Sun, L.; Li, X.; Hede, T.; Tu, Y.; Leck, C.; Ågren, H. Molecular dynamics simulations of the surface tension and structure of salt solutions and clusters. J. Phys. Chem. B 2012, 116, 3198– 3204, DOI: 10.1021/jp209178sThere is no corresponding record for this reference.
- 61Smith, R. Ion clustering in aqueous salt solutions near the liquid/vapor interface. Condens. Matter Phys. 2016, 19, 23002, DOI: 10.5488/CMP.19.23002There is no corresponding record for this reference.
- 62Ghosal, S.; Hemminger, J. C.; Bluhm, H.; Mun, B. S.; Hebenstreit, E. L. D.; Ketteler, G.; Ogletree, D. F.; Requejo, F. G.; Salmeron, M. Electron Spectroscopy of Aqueous Solution Interfaces Reveals Surface Enhancement of Halides. Science 2005, 307, 563– 566, DOI: 10.1126/science.1106525There is no corresponding record for this reference.
- 63Krisch, M. J.; D’Auria, R.; Brown, M. A.; Tobias, D. J.; Hemminger, C.; Ammann, M.; Starr, D. E.; Bluhm, H. The Effect of an Organic Surfactant on the Liquid–Vapor Interface of an Electrolyte Solution. J. Phys. Chem. C 2007, 111, 13497– 13509, DOI: 10.1021/jp073078bThere is no corresponding record for this reference.
- 64Onorato, R. M.; Otten, D. E.; Saykally, R. J. Measurement of Bromide Ion Affinities for the Air/Water and Dodecanol/Water Interfaces at Molar Concentrations by UV Second Harmonic Generation Spectroscopy. J. Phys. Chem. C 2010, 114, 13746– 13751, DOI: 10.1021/jp103454rThere is no corresponding record for this reference.
- 65Matubayasi, N.; Sugiyama, S.; Kanzaki, M.; Matuzawa, A. Thermodynamic Studies of the Adsorbed Films and Micelles of Sodium Taurodeoxycholate. J. Colloid Interface Sci. 1997, 196, 123– 127, DOI: 10.1006/jcis.1997.5213There is no corresponding record for this reference.
Supporting Information
Supporting Information
The following files are available free of charge. The Supporting Information is available free of charge at https://pubs.acs.org/doi/10.1021/acs.jced.5c00470.
Conversion of mass fraction to molality (Chapter S1, Table S1); solubility of the inorganic salts (Chapter S2, Tables S2 and S3); preparation of LiCl (Chapter S3, Figure S1); estimation of the surface tension from time series (Chapter S4, Figure S2); surface tension of water including uncertainties (Chapter S5, Table S4); calculation of the combined standard uncertainty of the molality (Chapter S6.1, Table S5); calculation of the combined standard uncertainty of the density (Chapter S6.2); calculation of the combined standard uncertainty of the surface tension (Chapter S6.3, Table S6); calculation of the combined standard uncertainty of the excess surface tension (Chapter S6.4); calculation of the combined standard uncertainty of the surface excess enthalpy (Chapter S6.5); density values at 293.15 and 278.15 K (Chapter S7 and Figure S3); surface tension as a function of the temperature of NaCl, NaI, LiCl, KCl, MgCl2, and Na2SO4 solution (Chapter S8 and Figures S4–S9); surface tension as a function of the molality of NaCl, NaI, LiCl, KCl, MgCl2, and Na2SO4 solution (Chapter S9 and Figures S10–S12); thermodynamic quantities such as surface excess energy, surface excess Helmholtz energy, and surface excess enthalpy at 293.15 K of NaCl, NaI, LiCl, KCl, MgCl2, and Na2SO4 solution (Chapter S10 and Figures S13 to S15); excess surface tension including fits for all aqueous inorganic salt solutions at 293.15 K (Chapter S11, Table S7, and Figures S16 and S17); graphical comparison of the density values with literature data (Chapter S12, Figures S18 and S19); graphical comparison of the surface tension values with literature data (Chapter S13, Figures S20 and S21) (PDF)
Terms & Conditions
Most electronic Supporting Information files are available without a subscription to ACS Web Editions. Such files may be downloaded by article for research use (if there is a public use license linked to the relevant article, that license may permit other uses). Permission may be obtained from ACS for other uses through requests via the RightsLink permission system: http://pubs.acs.org/page/copyright/permissions.html.