


This publication is Open Access under the license indicated. Learn More

ACS Editors' Choice® is a collection designed to feature scientific articles of broad public interest. Read the latest articles
Neutron Reflectometry on Superspreading and Non-Superspreading Trisiloxane SurfactantsClick to copy article linkArticle link copied!
- Joshua Reed*Joshua Reed*Email: [email protected]Institute for Condensed Matter Physics, TU Darmstadt, Hochschulstraße 8, 64289 Darmstadt, GermanyMore by Joshua Reed
- Séforah Carolina Marques SilvaSéforah Carolina Marques SilvaInstitute for Technical Thermodynamics, TU Darmstadt, Peter-Grünberg-Str. 10, 64287 Darmstadt, GermanyMore by Séforah Carolina Marques Silva
- Philipp GutfreundPhilipp GutfreundInstitut Laue-Langevin, 71 Av. des Martyrs, 38000 Grenoble, FranceMore by Philipp Gutfreund
- Joachim Venzmer*Joachim Venzmer*Email: [email protected]Research Interfacial Technology, Evonik Operations GmbH, Goldschmidtstr. 100, 45127 Essen, GermanyMore by Joachim Venzmer
- Tatiana Gambaryan-RoismanTatiana Gambaryan-RoismanInstitute for Technical Thermodynamics, TU Darmstadt, Peter-Grünberg-Str. 10, 64287 Darmstadt, GermanyMore by Tatiana Gambaryan-Roisman
- Emanuel Schneck*Emanuel Schneck*Email: [email protected]Institute for Condensed Matter Physics, TU Darmstadt, Hochschulstraße 8, 64289 Darmstadt, GermanyMore by Emanuel Schneck
Langmuir
Copyright © 2025 The Authors. Published by American Chemical Society. This publication is licensed under
License Summary*
You are free to share (copy and redistribute) this article in any medium or format within the parameters below:

Creative Commons (CC): This is a Creative Commons license.

Attribution (BY): Credit must be given to the creator.

Non-Commercial (NC): Only non-commercial uses of the work are permitted.

No Derivatives (ND): Derivative works may be created for non-commercial purposes, but sharing is prohibited.
*Disclaimer
This summary highlights only some of the key features and terms of the actual license. It is not a license and has no legal value. Carefully review the actual license before using these materials.
Abstract
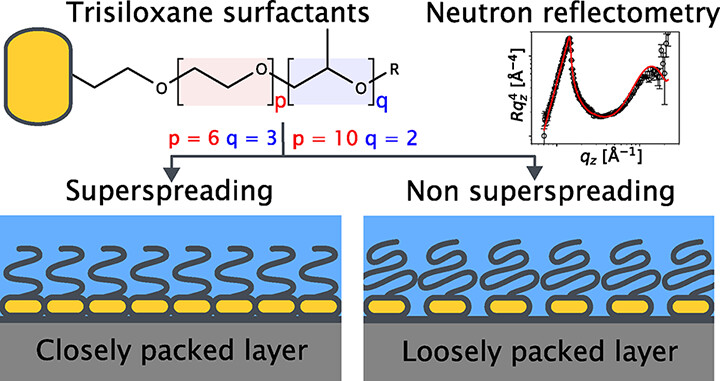
Certain trisiloxane surfactants have the remarkable property of being able to superspread: small volumes of the surfactant solution rapidly wet large areas of hydrophobic surfaces. The molecular properties of the surfactants that govern this technologically relevant process are still under debate. To gain a deeper understanding, the surfactant behavior during the spreading process needs to be studied at molecular length scales. Here, we present neutron reflectivity analyses of two trisiloxane surfactants of similar chemical structure, of which only one exhibits superspreading properties. We present an approach to determining the composition of the adsorbed surfactant layer in spread surfactant films at the solid–liquid interface, accounting for contributions from attenuated back-reflections of the neutron beam in films with thicknesses in the range of several tens to hundreds of micrometers. Differences between superspreading and non-superspreading surfactants with regard to their volume fraction profiles at the solid/liquid interface obtained in the self-consistent analysis of the reflectivity curves are in agreement with a simple explanation of the difference in spreading behavior based on thermodynamics.
This publication is licensed under
License Summary*
You are free to share(copy and redistribute) this article in any medium or format within the parameters below:
Creative Commons (CC): This is a Creative Commons license.
Attribution (BY): Credit must be given to the creator.
Non-Commercial (NC): Only non-commercial uses of the work are permitted.
No Derivatives (ND): Derivative works may be created for non-commercial purposes, but sharing is prohibited.
*Disclaimer
This summary highlights only some of the key features and terms of the actual license. It is not a license and has no legal value. Carefully review the actual license before using these materials.
Introduction
Figure 1
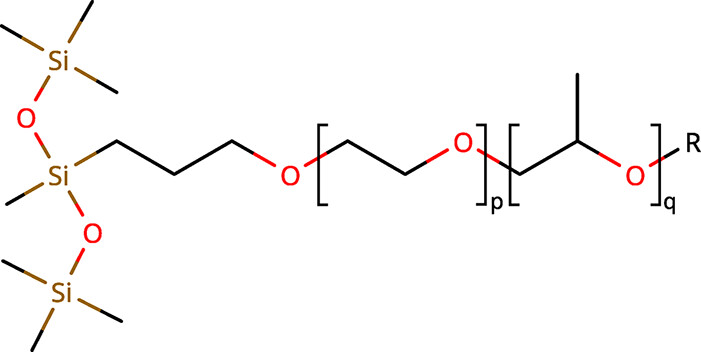
Figure 1. Chemical structure of S233 (p = 10, q = 2) and S240 (p = 6, q = 3). The structure consists of a hydrophobic trisiloxane group with a hydrophilic polyether chain whose monomer composition differs between the two molecules in terms of the number of ethylene oxide (p) and propylene oxide units (q).
Results
Reference Measurements
Figure 2
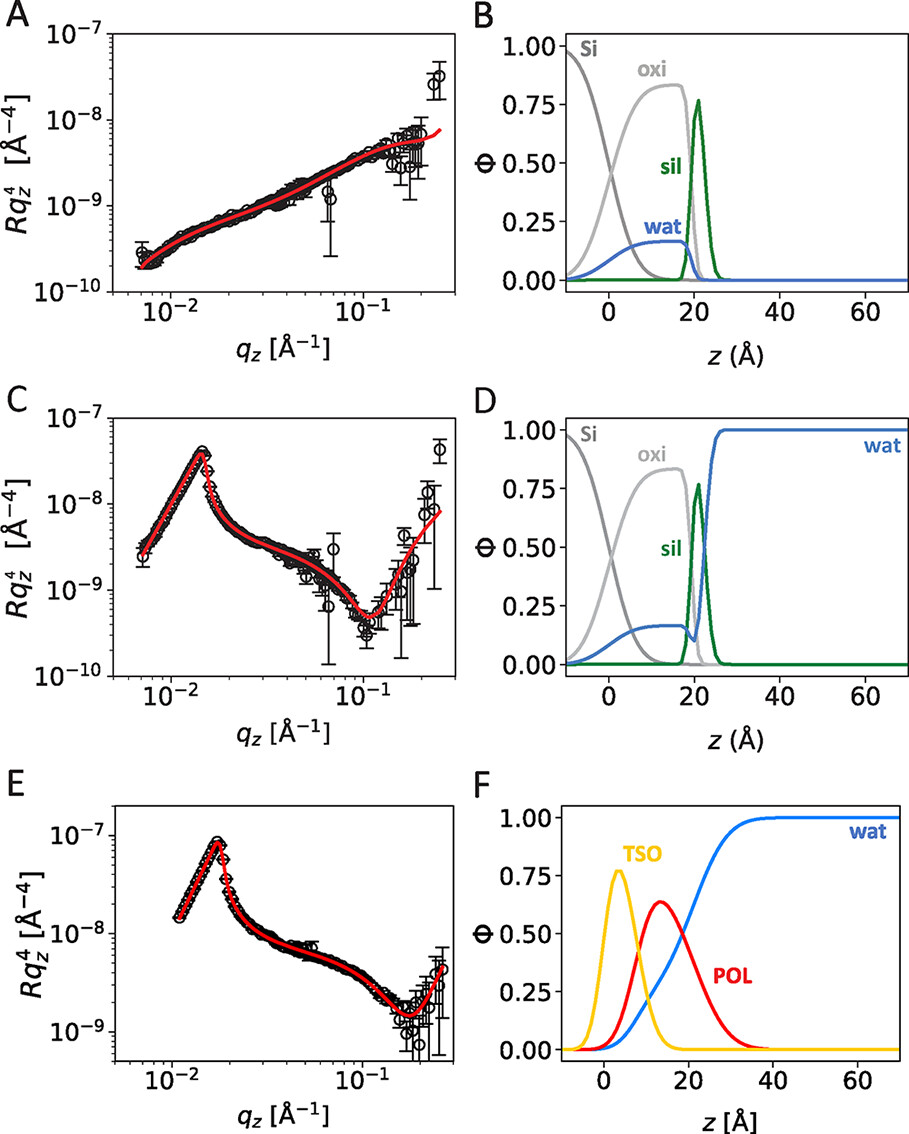
Figure 2. Neutron reflectivity data (A, C, E) and deduced volume fraction profiles (B, D, F) of the reference systems: (A, B) Bare silanized silicon block in air, (C, D) bare silanized silicon block in water, and (E, F) air–water interface of a 0.1 wt % surfactant solution (shown is S240). Solid lines in panels (A, C, E) indicate the best fits to the data that correspond to the volume fraction profiles in panels (B, D, F).
| surfactant | ||
|---|---|---|
| parameter | S240 | S233 |
| dTSO (±1.0) | 7.5 Å | 7.5 Å |
| dPOL (±1.0) | 13.5 Å | 16.0 Å |
| air/water interface | ||
|---|---|---|
| ΦPOL0 (±0.05) | 0.77 | 0.81 |
| ΦPOLmax (±0.05) | 0.63 | 0.70 |
| ΦPOLwat (±0.05) | 0.23 | 0.19 |
| solid/liquid interface | ||
|---|---|---|
| ΦPOL0 (±0.05) | 0.77 | 0.67 |
| ΦPOLmax (±0.05) | 0.63 | 0.59 |
| ΦPOLwat (±0.05) | 0.23 | 0.34 |
| ΦTSO0 (±0.05) | 1.00 | 0.83 |
| ΦTSOmax (±0.05) | 0.83 | 0.67 |
| ΦTSOwat (±0.05) | 0.00 | 0.17 |
Φj0 is the maximal volume fraction of layer j under hypothetical “no-roughness” conditions, Φjmax is its maximal volume fraction after roughness is applied, Φjwat is its water fraction, and dj is its thickness parameter.
S240 Layers Adsorbed to the Solid/Solution Interface
Figure 3
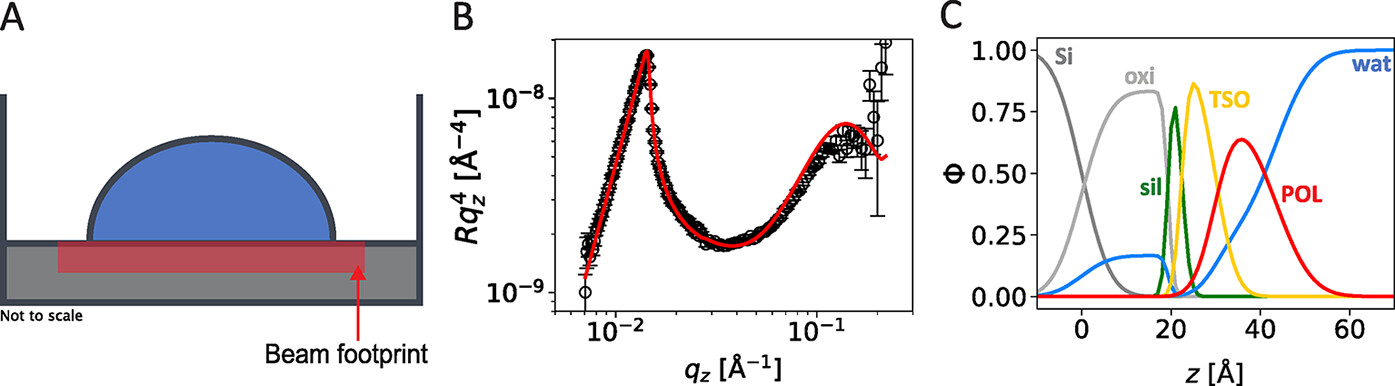
Figure 3. Illustration of a “thick” droplet of S240 solution obtained by the addition of 200 μL D2O to a superspread puddle of S240 (0.1 wt % 10 μL) (A). Neutron reflectivity data (B) and deduced volume fraction profiles (C) of this system. Solid lines in panel (B) indicate the best fits to the data that correspond to the volume fraction profiles in panel (C).
Superspread S240 Film
Figure 4
Figure 4. Illustration of a “thin” droplet of a (0.1 wt % 10 μL) superspread S240 solution (A). Neutron reflectivity data (B) of this system. Solid lines in (B) represent the best fit as described in the text.
Figure 5
Figure 5. Demonstration of a “thick” droplet of non-superspread 0.1 wt % S233 solution (A). Neutron reflectivity data (B) and deduced volume fraction profiles (C) of this system. Solid lines in panels (B) indicate the best fits to the data that correspond to the volume fraction profiles in panels (C).
Non-Superspreading Surfactant S233
Discussion
Figure 6
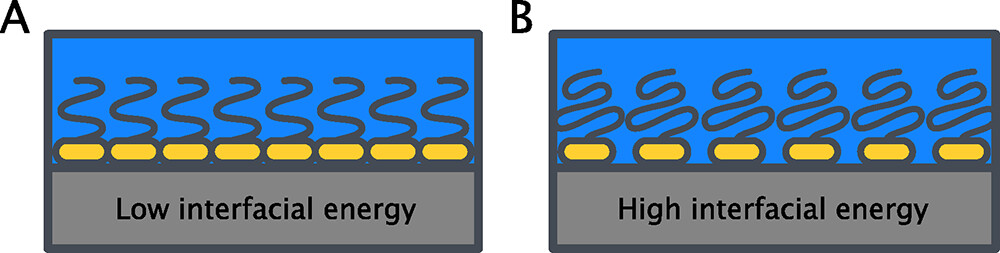
Figure 6. Visual representation of how adhered surfactant layers can affect the amount of water in contact with the hydrophobic surface. A closely packed surfactant monolayer in (A) minimizes water contact with the hydrophobic surface, efficiently reducing the interfacial energy. Less dense packing or weak adsorption in (B) leads to a smaller reduction of interfacial energy.
Experimental Section
Chemicals and Sample Preparation
NR Experiments
Solid Surfaces
Liquid Surfaces
Scattering Length Densities
| moiety | V [nm3] | ρ [10–6 Å–2] |
|---|---|---|
| ALP0620 | 0.822 | 0.59 |
| ALP0540 | 0.664 | 0.47 |
| HMTS | 0.476 | –0.09 |
| S233 | 1.294 | 0.31 |
| S240 | 1.145 | 0.23 |
Calculation of Theoretical Reflectivity Curves
Attenuation of the Neutron Beam Inside a Thin Water Film
Conclusions
Supporting Information
The Supporting Information is available free of charge at https://pubs.acs.org/doi/10.1021/acs.langmuir.5c03781.
Images of S240 and S233 droplets; Experimental setup; Reflectivity of S233 at the air/water interface; Synchrotron-based X-ray scattering and X-ray fluorescence measurements; Comparing different scenarios of water fractions in TSO for S240 and S233; Calculation of water-layer-internal incident angles; Further neutron reflectivity measurements of a 0.1 wt % 200 μL sample of S233; Calculation of surfactant SLD using densiometry measurements; Tabulated neutron reflectivity fitting parameters (PDF)
Terms & Conditions
Most electronic Supporting Information files are available without a subscription to ACS Web Editions. Such files may be downloaded by article for research use (if there is a public use license linked to the relevant article, that license may permit other uses). Permission may be obtained from ACS for other uses through requests via the RightsLink permission system: http://pubs.acs.org/page/copyright/permissions.html.
Author Information
- Joachim Venzmer - Research Interfacial Technology, Evonik Operations GmbH, Goldschmidtstr. 100, 45127 Essen, Germany;
 https://orcid.org/0000-0003-1919-8910;
- Emanuel Schneck - Institute for Condensed Matter Physics, TU Darmstadt, Hochschulstraße 8, 64289 Darmstadt, Germany;https://orcid.org/0000-0001-9769-2194;
- Philipp Gutfreund - Institut Laue-Langevin, 71 Av. des Martyrs, 38000 Grenoble, France;https://orcid.org/0000-0002-7412-8571
- Tatiana Gambaryan-Roisman - Institute for Technical Thermodynamics, TU Darmstadt, Peter-Grünberg-Str. 10, 64287 Darmstadt, Germany;https://orcid.org/0000-0003-0259-129X
J.R.: investigation, methodology, formal analysis, writing – original draft preparation; S.C.M.S.: investigation, formal analysis, writing – review and editing; P.G.: methodology, formal analysis, writing – review and editing; J.V.: conceptualization, investigation, writing – original draft preparation, acquisition of funding, supervision; T.G.-R.: conceptualization, investigation, writing – review and editing, acquisition of funding, supervision; E.S.: conceptualization, methodology, investigation, formal analysis, writing – original draft preparation, acquisition of funding, supervision.
Acknowledgments
The authors would like to thank the Institut Laue-Langevin (ILL) for beam time allocation (DOI:10.5291/ILL-DATA.9-10-1740), and the ILL Soft Condensed Matter laboratories for their support. We would also like to thank Hacer Yalcinkaya for the densiometry measurements. The research leading to these results received funding from the European Union’s Horizon 2020 research and innovation program under the Marie Skłodowska-Curie grant agreement number 955612 (NanoPaInt).
References
This article references 48 other publications.
- 1Venzmer, J. Superspreading ─ 20 years of physicochemical research. Curr. Opin. Colloid Interface Sci. 2011, 16, 335– 343, DOI: 10.1016/j.cocis.2010.11.006Google ScholarThere is no corresponding record for this reference.
- 2Kennedy, M.; Venzmer, J.; Wilkowski, S. Organic Superspreading Surfactant Blends vs. Trisiloxane Surfactants─Spreading, Wetting and Active Ingredient Uptake. Proceedings of Fifth International Symposium on Adjuvants for Agrochemicals , 1998; pp 113– 118.Google ScholarThere is no corresponding record for this reference.
- 3Kovalchuk, N. M.; Barton, A.; Trybala, A.; Starov, V. Mixtures of catanionic surfactants can be superspreaders: Comparison with trisiloxane superspreader. J. Colloid Interface Sci. 2015, 459, 250– 256, DOI: 10.1016/j.jcis.2015.08.024Google ScholarThere is no corresponding record for this reference.
- 4Agriculture - Evonik Industries, 2025. https://interfacial-chemistry.evonik.com/en/industries/agriculture-167005.html.Google ScholarThere is no corresponding record for this reference.
- 5Ross, S.; Becher, P. The history of the spreading coefficient. J. Colloid Interface Sci. 1992, 149, 575– 579, DOI: 10.1016/0021-9797(92)90445-RGoogle ScholarThere is no corresponding record for this reference.
- 6Williams, K.; Bertola, V.; Martin, D. S. Experimental investigation of a flowing superspreader solution using Reflection Anisotropy Spectroscopy. Results Phys. 2016, 6, 277– 279, DOI: 10.1016/j.rinp.2016.05.001Google ScholarThere is no corresponding record for this reference.
- 7Wang, X.; Chen, L.; Bonaccurso, E.; Venzmer, J. Dynamic Wetting of Hydrophobic Polymers by Aqueous Surfactant and Superspreader Solutions. Langmuir 2013, 29, 14855– 14864, DOI: 10.1021/la403994yGoogle ScholarThere is no corresponding record for this reference.
- 8Wang, X.; Bonaccurso, E.; Venzmer, J.; Garoff, S. Deposition of drops containing surfactants on liquid pools: Movement of the contact line, Marangoni ridge, capillary waves and interfacial particles. Colloids Surf., A 2015, 486, 53– 59, DOI: 10.1016/j.colsurfa.2015.09.029Google ScholarThere is no corresponding record for this reference.
- 9Wang, X.; Venzmer, J.; Bonaccurso, E. Surfactant-Enhanced Spreading of Sessile Water Drops on Polypropylene Surfaces. Langmuir 2016, 32, 8322– 8328, DOI: 10.1021/acs.langmuir.6b01357Google ScholarThere is no corresponding record for this reference.
- 10Kovalchuk, N. M.; Dunn, J.; Davies, J.; Simmons, M. J. H. Superspreading on Hydrophobic Substrates: Effect of Glycerol Additive. Colloids Interfaces 2019, 3, 51, DOI: 10.3390/colloids3020051Google ScholarThere is no corresponding record for this reference.
- 11Isele-Holder, R. E.; Berkels, B.; Ismail, A. E. Smoothing of contact lines in spreading droplets by trisiloxane surfactants and its relevance for superspreading. Soft Matter 2015, 11, 4527– 4539, DOI: 10.1039/C4SM02298JGoogle ScholarThere is no corresponding record for this reference.
- 12Nikolov, A. D.; Wasan, D. T.; Chengara, A.; Koczo, K.; Policello, G. A.; Kolossvary, I. Superspreading driven by Marangoni flow. Adv. Colloid Interface Sci. 2002, 96, 325– 338, DOI: 10.1016/S0001-8686(01)00087-2Google ScholarThere is no corresponding record for this reference.
- 13Chengara, A.; Nikolov, A. D.; Wasan, D. T. Spreading of a Water Drop Triggered by the Surface Tension Gradient Created by the Localized Addition of a Surfactant. Ind. Eng. Chem. Res. 2007, 46, 2987– 2995, DOI: 10.1021/ie060695yGoogle ScholarThere is no corresponding record for this reference.
- 14Nikolov, A.; Wasan, D. Current opinion in superspreading mechanisms. Adv. Colloid Interface Sci. 2015, 222, 517– 529, DOI: 10.1016/j.cis.2014.03.006Google ScholarThere is no corresponding record for this reference.
- 15Venzmer, J. Superspreading – Has the mystery been unraveled?. Adv. Colloid Interface Sci. 2021, 288, 102343 DOI: 10.1016/j.cis.2020.102343Google ScholarThere is no corresponding record for this reference.
- 16He, M.; Hill, R. M.; Lin, Z.; Scriven, L. E.; Davis, H. T. Phase behavior and microstructure of polyoxyethylene trisiloxane surfactants in aqueous solution. J. Phys. Chem. 1993, 97, 8820– 8834, DOI: 10.1021/j100136a030Google ScholarThere is no corresponding record for this reference.
- 17Sett, S.; Sahu, R. P.; Sinha-Ray, S.; Yarin, A. L. Superspreaders Versus “Cousin” Non-Superspreaders: Disjoining Pressure in Gravitational Film Drainage. Langmuir 2014, 30, 2619– 2631, DOI: 10.1021/la404754dGoogle ScholarThere is no corresponding record for this reference.
- 18Venzmer, J. Interfacial properties of (super) spreading trisiloxane surfactants. Curr. Opin. Colloid Interface Sci. 2024, 72, 101807 DOI: 10.1016/j.cocis.2024.101807Google ScholarThere is no corresponding record for this reference.
- 19Lu, J.; Thomas, R. Neutron reflection from wet interfaces. J. Chem. Soc., Faraday Trans. 1998, 94, 995– 1018, DOI: 10.1039/a707853fGoogle ScholarThere is no corresponding record for this reference.
- 20Plant, A. L. Supported hybrid bilayer membranes as rugged cell membrane mimics. Langmuir 1999, 15, 5128– 5135, DOI: 10.1021/la981662tGoogle ScholarThere is no corresponding record for this reference.
- 21Howse, J. R.; Steitz, R.; Pannek, M.; Simon, P.; Schubert, D. W.; Findenegg, G. H. Adsorbed surfactant layers at polymer/liquid interfaces. A neutron reflectivity study. Phys. Chem. Chem. Phys. 2001, 3, 4044– 4051, DOI: 10.1039/b101517fGoogle ScholarThere is no corresponding record for this reference.
- 22Gapon, I. V.; Kuzmenko, M. O.; Avdeev, M. V.; Ivanova, N. A. Study of the Temperature Effect in Aqueous Solutions of Trisiloxane Surfactants at the Interface with Titanium Oxide by Neutron Reflectometry. J. Surf. Invest. 2023, 17, 445– 449, DOI: 10.1134/S1027451023020258Google ScholarThere is no corresponding record for this reference.
- 23Schneck, E.; Berts, I.; Halperin, A.; Daillant, J.; Fragneto, G. Neutron reflectometry from poly (ethylene-glycol) brushes binding anti-PEG antibodies: Evidence of ternary adsorption. Biomaterials 2015, 46, 95– 104, DOI: 10.1016/j.biomaterials.2014.12.041Google ScholarThere is no corresponding record for this reference.
- 24Rodriguez-Loureiro, I.; Scoppola, E.; Bertinetti, L.; Barbetta, A.; Fragneto, G.; Schneck, E. Neutron reflectometry yields distance-dependent structures of nanometric polymer brushes interacting across water. Soft Matter 2017, 13, 5767– 5777, DOI: 10.1039/C7SM01066DGoogle ScholarThere is no corresponding record for this reference.
- 25Micciulla, S.; Gerelli, Y.; Campbell, R. A.; Schneck, E. A versatile method for the distance-dependent structural characterization of interacting soft interfaces by neutron reflectometry. Langmuir 2018, 34, 789– 800, DOI: 10.1021/acs.langmuir.7b02971Google ScholarThere is no corresponding record for this reference.
- 26Micciulla, S.; Gutfreund, P.; Kanduč, M.; Chiappisi, L. Pressure-Induced Phase Transitions of Nonionic Polymer Brushes. Macromolecules 2023, 56, 1177– 1188, DOI: 10.1021/acs.macromol.2c01979Google ScholarThere is no corresponding record for this reference.
- 27Seeck, O. H.; Deiter, C.; Pflaum, K.; Bertam, F.; Beerlink, A.; Franz, H.; Horbach, J.; Schulte-Schrepping, H.; Murphy, B. M.; Greve, M.; Magnussen, O. The high-resolution diffraction beamline P08 at PETRA III. J. Synchrotron Radiat. 2012, 19, 30– 38, DOI: 10.1107/S0909049511047236Google ScholarThere is no corresponding record for this reference.
- 28Shen, C.; Kirchhof, R.; Bertram, F. A grazing incidence diffraction setup for Langmuir trough experiments at the high-resolution diffraction beamline P08 at PETRA III. J. Phys.:Conf. Ser. 2022, 2380, 012047 DOI: 10.1088/1742-6596/2380/1/012047Google ScholarThere is no corresponding record for this reference.
- 29Mukhina, T.; Pabst, G.; Ruysschaert, J.-M.; Brezesinski, G.; Schneck, E. pH-Dependent physicochemical properties of ornithine lipid in mono-and bilayers. Phys. Chem. Chem. Phys. 2022, 24, 22778– 22791, DOI: 10.1039/D2CP01045CGoogle ScholarThere is no corresponding record for this reference.
- 30Mortara, L.; Mukhina, T.; Chaimovich, H.; Brezesinski, G.; van der Vegt, N. F.; Schneck, E. Anion competition at positively charged surfactant monolayers. Langmuir 2024, 40, 6949– 6961, DOI: 10.1021/acs.langmuir.3c04003Google ScholarThere is no corresponding record for this reference.
- 31Mora, S.; Daillant, J.; Luzet, D.; Struth, B. X-ray surface scattering investigation of Langmuir films: Phase transitions and elastic properties. Europhys. Lett. 2004, 66, 694, DOI: 10.1209/epl/i2003-10252-6Google ScholarThere is no corresponding record for this reference.
- 32O’Flaherty, S. M.; Wiegart, L.; Konovalov, O.; Struth, B. Observation of zinc phthalocyanine aggregates on a water surface using grazing incidence x-ray scattering. Langmuir 2005, 21, 11161– 11166, DOI: 10.1021/la051001dGoogle ScholarThere is no corresponding record for this reference.
- 33Pusterla, J.; Scoppola, E.; Appel, C.; Mukhina, T.; Shen, C.; Brezesinski, G.; Schneck, E. Characterization of lipid bilayers adsorbed to functionalized air/water interfaces. Nanoscale 2022, 14, 15048– 15059, DOI: 10.1039/D2NR03334HGoogle ScholarThere is no corresponding record for this reference.
- 34Brezesinski, G.; Schneck, E. Investigating Ions at Amphiphilic Monolayers with X-ray Fluorescence. Langmuir 2019, 35, 8531– 8542, DOI: 10.1021/acs.langmuir.9b00191Google ScholarThere is no corresponding record for this reference.
- 35Grava, M.; Ibrahim, M.; Sudarsan, A.; Pusterla, J.; Philipp, J.; Rädler, J. O.; Schwierz, N.; Schneck, E. Combining molecular dynamics simulations and x-ray scattering techniques for the accurate treatment of protonation degree and packing of ionizable lipids in monolayers. J. Chem. Phys. 2023, 159, 154706, DOI: 10.1063/5.0172552Google ScholarThere is no corresponding record for this reference.
- 36Silva, S. C. M.; Gambaryan-Roisman, T.; Venzmer, J. Surface tension behavior of superspreading and non-superspreading trisiloxane surfactants. Colloid Polym. Sci. 2023, 301, 739– 744, DOI: 10.1007/s00396-023-05106-0Google ScholarThere is no corresponding record for this reference.
- 37Browning, K. L.; Griffin, L. R.; Gutfreund, P.; Barker, R. D.; Clifton, L. A.; Hughes, A.; Clarke, S. M. Specular neutron reflection at the mica/water interface–irreversible adsorption of a cationic dichain surfactant. J. Appl. Crystallogr. 2014, 47, 1638– 1646, DOI: 10.1107/S1600576714016318Google ScholarThere is no corresponding record for this reference.
- 38Wagner, R.; Wu, Y.; Czichocki, G.; Berlepsch, H. V.; Rexin, F.; Perepelittchenko, L. Silicon-modified surfactants and wetting: II. Temperature-dependent spreading behaviour of oligoethylene glycol derivatives of heptamethyltrisiloxane. Appl. Organomet. Chem. 1999, 13, 201– 208, DOI: 10.1002/(SICI)1099-0739(199903)13:3<201::AID-AOC858>3.0.CO;2-5Google ScholarThere is no corresponding record for this reference.
- 39Svitova, T. F.; Hill, R. M.; Radke, C. J. Spreading of Aqueous Trisiloxane Surfactant Solutions over Liquid Hydrophobic Substrates. Langmuir 2001, 17, 335– 348, DOI: 10.1021/la000019fGoogle ScholarThere is no corresponding record for this reference.
- 40Kovalchuk, N. M.; Sagisaka, M.; Komiyama, H.; Simmons, M. J. Spreading of aqueous surfactant solutions on oil substrates: Superspreaders vs non-superspreaders. J. Colloid Interface Sci. 2024, 661, 1046– 1059, DOI: 10.1016/j.jcis.2024.02.031Google ScholarThere is no corresponding record for this reference.
- 41Scoppola, E.; Watkins, E. B.; Campbell, R. A.; Konovalov, O.; Girard, L.; Dufrêche, J.-F.; Ferru, G.; Fragneto, G.; Diat, O. Solvent extraction: Structure of the liquid–liquid interface containing a diamide ligand. Angew. Chem. 2016, 128, 9472– 9476, DOI: 10.1002/ange.201603395Google ScholarThere is no corresponding record for this reference.
- 42Fainerman, V. B.; Kovalchuk, V. I.; Aksenenko, E. V.; Ravera, F.; Liggieri, L.; Loglio, G.; Makievski, A. V.; Mishchuk, N. O.; Schneck, E.; Miller, R. A multistate adsorption model for the adsorption of C14EO4 and C14EO8 at the solution/air interface. Colloids Interfaces 2021, 5, 39, DOI: 10.3390/colloids5030039Google ScholarThere is no corresponding record for this reference.
- 43Kanduč, M.; Reed, J.; Schlaich, A.; Schneck, E. Molecular dynamics simulations as support for experimental studies on surfactant interfacial layers. Curr. Opin. Colloid Interface Sci. 2024, 72, 101816 DOI: 10.1016/j.cocis.2024.101816Google ScholarThere is no corresponding record for this reference.
- 44Schneck, E.; Reed, J.; Seki, T.; Nagata, Y.; Kanduč, M. Experimental and simulation-based characterization of surfactant adsorption layers at fluid interfaces. Adv. Colloid Interface Sci. 2024, 331, 103237 DOI: 10.1016/j.cis.2024.103237Google ScholarThere is no corresponding record for this reference.
- 45Zhao, X.; Khandoker, Md. A. R.; Golovin, K. Non-Fluorinated Omniphobic Paper with Ultralow Contact Angle Hysteresis. ACS Appl. Mater. Interfaces 2020, 12, 15748– 15756, DOI: 10.1021/acsami.0c01678Google ScholarThere is no corresponding record for this reference.
- 46Campbell, R.; Wacklin, H.; Sutton, I.; Cubitt, R.; Fragneto, G. FIGARO: The new horizontal neutron reflectometer at the ILL. Eur. Phys. J. Plus 2011, 126, 1– 22, DOI: 10.1140/epjp/i2011-11107-8Google ScholarThere is no corresponding record for this reference.
- 47GESTIS-Stoffdatenbank, 2024. https://gestis.dguv.de/data?name=490984, [Online; accessed Mar 7, 2025].Google ScholarThere is no corresponding record for this reference.
- 48Parratt, L. G. Surface studies of solids by total reflection of X-rays. Phys. Rev. 1954, 95, 359, DOI: 10.1103/PhysRev.95.359Google ScholarThere is no corresponding record for this reference.
Cited By
This article has not yet been cited by other publications.
Langmuir
Copyright © 2025 The Authors. Published by American Chemical Society. This publication is licensed under
License Summary*
You are free to share (copy and redistribute) this article in any medium or format within the parameters below:
Creative Commons (CC): This is a Creative Commons license.
Attribution (BY): Credit must be given to the creator.
Non-Commercial (NC): Only non-commercial uses of the work are permitted.
No Derivatives (ND): Derivative works may be created for non-commercial purposes, but sharing is prohibited.
*Disclaimer
This summary highlights only some of the key features and terms of the actual license. It is not a license and has no legal value. Carefully review the actual license before using these materials.
Article Views
Altmetric
Citations
Article Views are the COUNTER-compliant sum of full text article downloads since November 2008 (both PDF and HTML) across all institutions and individuals. These metrics are regularly updated to reflect usage leading up to the last few days.
Citations are the number of other articles citing this article, calculated by Crossref and updated daily. Find more information about Crossref citation counts.
The Altmetric Attention Score is a quantitative measure of the attention that a research article has received online. Clicking on the donut icon will load a page at altmetric.com with additional details about the score and the social media presence for the given article. Find more information on the Altmetric Attention Score and how the score is calculated.
Recommended Articles
Abstract
Figure 1

Figure 1. Chemical structure of S233 (p = 10, q = 2) and S240 (p = 6, q = 3). The structure consists of a hydrophobic trisiloxane group with a hydrophilic polyether chain whose monomer composition differs between the two molecules in terms of the number of ethylene oxide (p) and propylene oxide units (q).
Figure 2
Figure 2. Neutron reflectivity data (A, C, E) and deduced volume fraction profiles (B, D, F) of the reference systems: (A, B) Bare silanized silicon block in air, (C, D) bare silanized silicon block in water, and (E, F) air–water interface of a 0.1 wt % surfactant solution (shown is S240). Solid lines in panels (A, C, E) indicate the best fits to the data that correspond to the volume fraction profiles in panels (B, D, F).
Figure 3

Figure 3. Illustration of a “thick” droplet of S240 solution obtained by the addition of 200 μL D2O to a superspread puddle of S240 (0.1 wt % 10 μL) (A). Neutron reflectivity data (B) and deduced volume fraction profiles (C) of this system. Solid lines in panel (B) indicate the best fits to the data that correspond to the volume fraction profiles in panel (C).
Figure 4
Figure 4. Illustration of a “thin” droplet of a (0.1 wt % 10 μL) superspread S240 solution (A). Neutron reflectivity data (B) of this system. Solid lines in (B) represent the best fit as described in the text.
Figure 5
Figure 5. Demonstration of a “thick” droplet of non-superspread 0.1 wt % S233 solution (A). Neutron reflectivity data (B) and deduced volume fraction profiles (C) of this system. Solid lines in panels (B) indicate the best fits to the data that correspond to the volume fraction profiles in panels (C).
Figure 6
Figure 6. Visual representation of how adhered surfactant layers can affect the amount of water in contact with the hydrophobic surface. A closely packed surfactant monolayer in (A) minimizes water contact with the hydrophobic surface, efficiently reducing the interfacial energy. Less dense packing or weak adsorption in (B) leads to a smaller reduction of interfacial energy.
References
This article references 48 other publications.
- 1Venzmer, J. Superspreading ─ 20 years of physicochemical research. Curr. Opin. Colloid Interface Sci. 2011, 16, 335– 343, DOI: 10.1016/j.cocis.2010.11.006There is no corresponding record for this reference.
- 2Kennedy, M.; Venzmer, J.; Wilkowski, S. Organic Superspreading Surfactant Blends vs. Trisiloxane Surfactants─Spreading, Wetting and Active Ingredient Uptake. Proceedings of Fifth International Symposium on Adjuvants for Agrochemicals , 1998; pp 113– 118.There is no corresponding record for this reference.
- 3Kovalchuk, N. M.; Barton, A.; Trybala, A.; Starov, V. Mixtures of catanionic surfactants can be superspreaders: Comparison with trisiloxane superspreader. J. Colloid Interface Sci. 2015, 459, 250– 256, DOI: 10.1016/j.jcis.2015.08.024There is no corresponding record for this reference.
- 4Agriculture - Evonik Industries, 2025. https://interfacial-chemistry.evonik.com/en/industries/agriculture-167005.html.There is no corresponding record for this reference.
- 5Ross, S.; Becher, P. The history of the spreading coefficient. J. Colloid Interface Sci. 1992, 149, 575– 579, DOI: 10.1016/0021-9797(92)90445-RThere is no corresponding record for this reference.
- 6Williams, K.; Bertola, V.; Martin, D. S. Experimental investigation of a flowing superspreader solution using Reflection Anisotropy Spectroscopy. Results Phys. 2016, 6, 277– 279, DOI: 10.1016/j.rinp.2016.05.001There is no corresponding record for this reference.
- 7Wang, X.; Chen, L.; Bonaccurso, E.; Venzmer, J. Dynamic Wetting of Hydrophobic Polymers by Aqueous Surfactant and Superspreader Solutions. Langmuir 2013, 29, 14855– 14864, DOI: 10.1021/la403994yThere is no corresponding record for this reference.
- 8Wang, X.; Bonaccurso, E.; Venzmer, J.; Garoff, S. Deposition of drops containing surfactants on liquid pools: Movement of the contact line, Marangoni ridge, capillary waves and interfacial particles. Colloids Surf., A 2015, 486, 53– 59, DOI: 10.1016/j.colsurfa.2015.09.029There is no corresponding record for this reference.
- 9Wang, X.; Venzmer, J.; Bonaccurso, E. Surfactant-Enhanced Spreading of Sessile Water Drops on Polypropylene Surfaces. Langmuir 2016, 32, 8322– 8328, DOI: 10.1021/acs.langmuir.6b01357There is no corresponding record for this reference.
- 10Kovalchuk, N. M.; Dunn, J.; Davies, J.; Simmons, M. J. H. Superspreading on Hydrophobic Substrates: Effect of Glycerol Additive. Colloids Interfaces 2019, 3, 51, DOI: 10.3390/colloids3020051There is no corresponding record for this reference.
- 11Isele-Holder, R. E.; Berkels, B.; Ismail, A. E. Smoothing of contact lines in spreading droplets by trisiloxane surfactants and its relevance for superspreading. Soft Matter 2015, 11, 4527– 4539, DOI: 10.1039/C4SM02298JThere is no corresponding record for this reference.
- 12Nikolov, A. D.; Wasan, D. T.; Chengara, A.; Koczo, K.; Policello, G. A.; Kolossvary, I. Superspreading driven by Marangoni flow. Adv. Colloid Interface Sci. 2002, 96, 325– 338, DOI: 10.1016/S0001-8686(01)00087-2There is no corresponding record for this reference.
- 13Chengara, A.; Nikolov, A. D.; Wasan, D. T. Spreading of a Water Drop Triggered by the Surface Tension Gradient Created by the Localized Addition of a Surfactant. Ind. Eng. Chem. Res. 2007, 46, 2987– 2995, DOI: 10.1021/ie060695yThere is no corresponding record for this reference.
- 14Nikolov, A.; Wasan, D. Current opinion in superspreading mechanisms. Adv. Colloid Interface Sci. 2015, 222, 517– 529, DOI: 10.1016/j.cis.2014.03.006There is no corresponding record for this reference.
- 15Venzmer, J. Superspreading – Has the mystery been unraveled?. Adv. Colloid Interface Sci. 2021, 288, 102343 DOI: 10.1016/j.cis.2020.102343There is no corresponding record for this reference.
- 16He, M.; Hill, R. M.; Lin, Z.; Scriven, L. E.; Davis, H. T. Phase behavior and microstructure of polyoxyethylene trisiloxane surfactants in aqueous solution. J. Phys. Chem. 1993, 97, 8820– 8834, DOI: 10.1021/j100136a030There is no corresponding record for this reference.
- 17Sett, S.; Sahu, R. P.; Sinha-Ray, S.; Yarin, A. L. Superspreaders Versus “Cousin” Non-Superspreaders: Disjoining Pressure in Gravitational Film Drainage. Langmuir 2014, 30, 2619– 2631, DOI: 10.1021/la404754dThere is no corresponding record for this reference.
- 18Venzmer, J. Interfacial properties of (super) spreading trisiloxane surfactants. Curr. Opin. Colloid Interface Sci. 2024, 72, 101807 DOI: 10.1016/j.cocis.2024.101807There is no corresponding record for this reference.
- 19Lu, J.; Thomas, R. Neutron reflection from wet interfaces. J. Chem. Soc., Faraday Trans. 1998, 94, 995– 1018, DOI: 10.1039/a707853fThere is no corresponding record for this reference.
- 20Plant, A. L. Supported hybrid bilayer membranes as rugged cell membrane mimics. Langmuir 1999, 15, 5128– 5135, DOI: 10.1021/la981662tThere is no corresponding record for this reference.
- 21Howse, J. R.; Steitz, R.; Pannek, M.; Simon, P.; Schubert, D. W.; Findenegg, G. H. Adsorbed surfactant layers at polymer/liquid interfaces. A neutron reflectivity study. Phys. Chem. Chem. Phys. 2001, 3, 4044– 4051, DOI: 10.1039/b101517fThere is no corresponding record for this reference.
- 22Gapon, I. V.; Kuzmenko, M. O.; Avdeev, M. V.; Ivanova, N. A. Study of the Temperature Effect in Aqueous Solutions of Trisiloxane Surfactants at the Interface with Titanium Oxide by Neutron Reflectometry. J. Surf. Invest. 2023, 17, 445– 449, DOI: 10.1134/S1027451023020258There is no corresponding record for this reference.
- 23Schneck, E.; Berts, I.; Halperin, A.; Daillant, J.; Fragneto, G. Neutron reflectometry from poly (ethylene-glycol) brushes binding anti-PEG antibodies: Evidence of ternary adsorption. Biomaterials 2015, 46, 95– 104, DOI: 10.1016/j.biomaterials.2014.12.041There is no corresponding record for this reference.
- 24Rodriguez-Loureiro, I.; Scoppola, E.; Bertinetti, L.; Barbetta, A.; Fragneto, G.; Schneck, E. Neutron reflectometry yields distance-dependent structures of nanometric polymer brushes interacting across water. Soft Matter 2017, 13, 5767– 5777, DOI: 10.1039/C7SM01066DThere is no corresponding record for this reference.
- 25Micciulla, S.; Gerelli, Y.; Campbell, R. A.; Schneck, E. A versatile method for the distance-dependent structural characterization of interacting soft interfaces by neutron reflectometry. Langmuir 2018, 34, 789– 800, DOI: 10.1021/acs.langmuir.7b02971There is no corresponding record for this reference.
- 26Micciulla, S.; Gutfreund, P.; Kanduč, M.; Chiappisi, L. Pressure-Induced Phase Transitions of Nonionic Polymer Brushes. Macromolecules 2023, 56, 1177– 1188, DOI: 10.1021/acs.macromol.2c01979There is no corresponding record for this reference.
- 27Seeck, O. H.; Deiter, C.; Pflaum, K.; Bertam, F.; Beerlink, A.; Franz, H.; Horbach, J.; Schulte-Schrepping, H.; Murphy, B. M.; Greve, M.; Magnussen, O. The high-resolution diffraction beamline P08 at PETRA III. J. Synchrotron Radiat. 2012, 19, 30– 38, DOI: 10.1107/S0909049511047236There is no corresponding record for this reference.
- 28Shen, C.; Kirchhof, R.; Bertram, F. A grazing incidence diffraction setup for Langmuir trough experiments at the high-resolution diffraction beamline P08 at PETRA III. J. Phys.:Conf. Ser. 2022, 2380, 012047 DOI: 10.1088/1742-6596/2380/1/012047There is no corresponding record for this reference.
- 29Mukhina, T.; Pabst, G.; Ruysschaert, J.-M.; Brezesinski, G.; Schneck, E. pH-Dependent physicochemical properties of ornithine lipid in mono-and bilayers. Phys. Chem. Chem. Phys. 2022, 24, 22778– 22791, DOI: 10.1039/D2CP01045CThere is no corresponding record for this reference.
- 30Mortara, L.; Mukhina, T.; Chaimovich, H.; Brezesinski, G.; van der Vegt, N. F.; Schneck, E. Anion competition at positively charged surfactant monolayers. Langmuir 2024, 40, 6949– 6961, DOI: 10.1021/acs.langmuir.3c04003There is no corresponding record for this reference.
- 31Mora, S.; Daillant, J.; Luzet, D.; Struth, B. X-ray surface scattering investigation of Langmuir films: Phase transitions and elastic properties. Europhys. Lett. 2004, 66, 694, DOI: 10.1209/epl/i2003-10252-6There is no corresponding record for this reference.
- 32O’Flaherty, S. M.; Wiegart, L.; Konovalov, O.; Struth, B. Observation of zinc phthalocyanine aggregates on a water surface using grazing incidence x-ray scattering. Langmuir 2005, 21, 11161– 11166, DOI: 10.1021/la051001dThere is no corresponding record for this reference.
- 33Pusterla, J.; Scoppola, E.; Appel, C.; Mukhina, T.; Shen, C.; Brezesinski, G.; Schneck, E. Characterization of lipid bilayers adsorbed to functionalized air/water interfaces. Nanoscale 2022, 14, 15048– 15059, DOI: 10.1039/D2NR03334HThere is no corresponding record for this reference.
- 34Brezesinski, G.; Schneck, E. Investigating Ions at Amphiphilic Monolayers with X-ray Fluorescence. Langmuir 2019, 35, 8531– 8542, DOI: 10.1021/acs.langmuir.9b00191There is no corresponding record for this reference.
- 35Grava, M.; Ibrahim, M.; Sudarsan, A.; Pusterla, J.; Philipp, J.; Rädler, J. O.; Schwierz, N.; Schneck, E. Combining molecular dynamics simulations and x-ray scattering techniques for the accurate treatment of protonation degree and packing of ionizable lipids in monolayers. J. Chem. Phys. 2023, 159, 154706, DOI: 10.1063/5.0172552There is no corresponding record for this reference.
- 36Silva, S. C. M.; Gambaryan-Roisman, T.; Venzmer, J. Surface tension behavior of superspreading and non-superspreading trisiloxane surfactants. Colloid Polym. Sci. 2023, 301, 739– 744, DOI: 10.1007/s00396-023-05106-0There is no corresponding record for this reference.
- 37Browning, K. L.; Griffin, L. R.; Gutfreund, P.; Barker, R. D.; Clifton, L. A.; Hughes, A.; Clarke, S. M. Specular neutron reflection at the mica/water interface–irreversible adsorption of a cationic dichain surfactant. J. Appl. Crystallogr. 2014, 47, 1638– 1646, DOI: 10.1107/S1600576714016318There is no corresponding record for this reference.
- 38Wagner, R.; Wu, Y.; Czichocki, G.; Berlepsch, H. V.; Rexin, F.; Perepelittchenko, L. Silicon-modified surfactants and wetting: II. Temperature-dependent spreading behaviour of oligoethylene glycol derivatives of heptamethyltrisiloxane. Appl. Organomet. Chem. 1999, 13, 201– 208, DOI: 10.1002/(SICI)1099-0739(199903)13:3<201::AID-AOC858>3.0.CO;2-5There is no corresponding record for this reference.
- 39Svitova, T. F.; Hill, R. M.; Radke, C. J. Spreading of Aqueous Trisiloxane Surfactant Solutions over Liquid Hydrophobic Substrates. Langmuir 2001, 17, 335– 348, DOI: 10.1021/la000019fThere is no corresponding record for this reference.
- 40Kovalchuk, N. M.; Sagisaka, M.; Komiyama, H.; Simmons, M. J. Spreading of aqueous surfactant solutions on oil substrates: Superspreaders vs non-superspreaders. J. Colloid Interface Sci. 2024, 661, 1046– 1059, DOI: 10.1016/j.jcis.2024.02.031There is no corresponding record for this reference.
- 41Scoppola, E.; Watkins, E. B.; Campbell, R. A.; Konovalov, O.; Girard, L.; Dufrêche, J.-F.; Ferru, G.; Fragneto, G.; Diat, O. Solvent extraction: Structure of the liquid–liquid interface containing a diamide ligand. Angew. Chem. 2016, 128, 9472– 9476, DOI: 10.1002/ange.201603395There is no corresponding record for this reference.
- 42Fainerman, V. B.; Kovalchuk, V. I.; Aksenenko, E. V.; Ravera, F.; Liggieri, L.; Loglio, G.; Makievski, A. V.; Mishchuk, N. O.; Schneck, E.; Miller, R. A multistate adsorption model for the adsorption of C14EO4 and C14EO8 at the solution/air interface. Colloids Interfaces 2021, 5, 39, DOI: 10.3390/colloids5030039There is no corresponding record for this reference.
- 43Kanduč, M.; Reed, J.; Schlaich, A.; Schneck, E. Molecular dynamics simulations as support for experimental studies on surfactant interfacial layers. Curr. Opin. Colloid Interface Sci. 2024, 72, 101816 DOI: 10.1016/j.cocis.2024.101816There is no corresponding record for this reference.
- 44Schneck, E.; Reed, J.; Seki, T.; Nagata, Y.; Kanduč, M. Experimental and simulation-based characterization of surfactant adsorption layers at fluid interfaces. Adv. Colloid Interface Sci. 2024, 331, 103237 DOI: 10.1016/j.cis.2024.103237There is no corresponding record for this reference.
- 45Zhao, X.; Khandoker, Md. A. R.; Golovin, K. Non-Fluorinated Omniphobic Paper with Ultralow Contact Angle Hysteresis. ACS Appl. Mater. Interfaces 2020, 12, 15748– 15756, DOI: 10.1021/acsami.0c01678There is no corresponding record for this reference.
- 46Campbell, R.; Wacklin, H.; Sutton, I.; Cubitt, R.; Fragneto, G. FIGARO: The new horizontal neutron reflectometer at the ILL. Eur. Phys. J. Plus 2011, 126, 1– 22, DOI: 10.1140/epjp/i2011-11107-8There is no corresponding record for this reference.
- 47GESTIS-Stoffdatenbank, 2024. https://gestis.dguv.de/data?name=490984, [Online; accessed Mar 7, 2025].There is no corresponding record for this reference.
- 48Parratt, L. G. Surface studies of solids by total reflection of X-rays. Phys. Rev. 1954, 95, 359, DOI: 10.1103/PhysRev.95.359There is no corresponding record for this reference.
Supporting Information
Supporting Information
The Supporting Information is available free of charge at https://pubs.acs.org/doi/10.1021/acs.langmuir.5c03781.
Images of S240 and S233 droplets; Experimental setup; Reflectivity of S233 at the air/water interface; Synchrotron-based X-ray scattering and X-ray fluorescence measurements; Comparing different scenarios of water fractions in TSO for S240 and S233; Calculation of water-layer-internal incident angles; Further neutron reflectivity measurements of a 0.1 wt % 200 μL sample of S233; Calculation of surfactant SLD using densiometry measurements; Tabulated neutron reflectivity fitting parameters (PDF)
Terms & Conditions
Most electronic Supporting Information files are available without a subscription to ACS Web Editions. Such files may be downloaded by article for research use (if there is a public use license linked to the relevant article, that license may permit other uses). Permission may be obtained from ACS for other uses through requests via the RightsLink permission system: http://pubs.acs.org/page/copyright/permissions.html.