


This publication is Open Access under the license indicated. Learn More

ACS Editors' Choice® is a collection designed to feature scientific articles of broad public interest. Read the latest articles
The Metabolic State of E. coli Influences Fosfomycin Efficacy and Promotes Resistance EvolutionClick to copy article linkArticle link copied!
- Andreas VerhülsdonkAndreas VerhülsdonkInterfaculty Institute of Microbiology and Infection Medicine, University of Tübingen, 72076 Tübingen, GermanyCluster of Excellence “Controlling Microbes to Fight Infections”, University of Tübingen, 72076 Tübingen, GermanyM3 Research Center, University of Tübingen, Otfried-Müller-Str. 37, 72076 Tübingen, GermanyMore by Andreas Verhülsdonk
- Amelie StadelmannAmelie StadelmannInterfaculty Institute of Microbiology and Infection Medicine, University of Tübingen, 72076 Tübingen, GermanyCluster of Excellence “Controlling Microbes to Fight Infections”, University of Tübingen, 72076 Tübingen, GermanyM3 Research Center, University of Tübingen, Otfried-Müller-Str. 37, 72076 Tübingen, GermanyMore by Amelie Stadelmann
- Fabian SmollichFabian SmollichInterfaculty Institute of Microbiology and Infection Medicine, University of Tübingen, 72076 Tübingen, GermanyCluster of Excellence “Controlling Microbes to Fight Infections”, University of Tübingen, 72076 Tübingen, GermanyM3 Research Center, University of Tübingen, Otfried-Müller-Str. 37, 72076 Tübingen, GermanyMore by Fabian Smollich
- Johanna RappJohanna RappInterfaculty Institute of Microbiology and Infection Medicine, University of Tübingen, 72076 Tübingen, GermanyCluster of Excellence “Controlling Microbes to Fight Infections”, University of Tübingen, 72076 Tübingen, GermanyM3 Research Center, University of Tübingen, Otfried-Müller-Str. 37, 72076 Tübingen, GermanyMore by Johanna Rapp
- Daniel StraubDaniel StraubM3 Research Center, University of Tübingen, Otfried-Müller-Str. 37, 72076 Tübingen, GermanyQuantitative Biology Center (QBiC), University of Tübingen, Otfried-Müller-Str. 37, 72076 Tübingen, GermanyMore by Daniel Straub
- Hannes Link*Hannes Link*Email: [email protected]Interfaculty Institute of Microbiology and Infection Medicine, University of Tübingen, 72076 Tübingen, GermanyCluster of Excellence “Controlling Microbes to Fight Infections”, University of Tübingen, 72076 Tübingen, GermanyM3 Research Center, University of Tübingen, Otfried-Müller-Str. 37, 72076 Tübingen, GermanyMore by Hannes Link
ACS Infectious Diseases
Copyright © 2026 The Authors. Published by American Chemical Society. This publication is licensed under
License Summary*
You are free to share (copy and redistribute) this article in any medium or format and to adapt (remix, transform, and build upon) the material for any purpose, even commercially within the parameters below:

Creative Commons (CC): This is a Creative Commons license.

Attribution (BY): Credit must be given to the creator.
*Disclaimer
This summary highlights only some of the key features and terms of the actual license. It is not a license and has no legal value. Carefully review the actual license before using these materials.
Abstract
The phosphonic antibiotic fosfomycin is a bacterial cell wall synthesis inhibitor that targets MurA, the first enzyme in the peptidoglycan pathway. Transporter loss or enzymatic inactivation confers resistance to fosfomycin, but whether the metabolic state of a bacterium influences the efficacy of this antibiotic has not been characterized. Here, we used an Escherichia coli CRISPR interference library targeting 1,515 metabolic genes to identify metabolic activities that influence fosfomycin efficacy. We discovered that knockdowns of ATP synthase and pyruvate kinase genes lead to a regrowth phenotype, whereby cells resume growth after an initial phase of killing. By following up on this phenotype with population analysis profile tests and repeated treatment cycles, we found evidence that a heteroresistant population may promote the evolution of fosfomycin resistance. Whole-genome sequencing of the pykF CRISPRi strain after 24 h of fosfomycin exposure revealed that the acid stress protein-encoding gene ibaG, which is upstream of murA, carries a mutation that confers fosfomycin resistance. Metabolome analysis showed accumulation of the MurA substrate phosphoenolpyruvate in regrowing cells, which may compete with fosfomycin for binding to MurA. Transcriptome analysis provided further insight into the mechanism of cell regrowth, including upregulation of genes encoding cell envelope stress response regulators such as cpxP. These results suggest that the metabolic state can modulate the efficacy of fosfomycin and contribute to resistance evolution.
This publication is licensed under
License Summary*
You are free to share(copy and redistribute) this article in any medium or format and to adapt(remix, transform, and build upon) the material for any purpose, even commercially within the parameters below:
Creative Commons (CC): This is a Creative Commons license.
Attribution (BY): Credit must be given to the creator.
*Disclaimer
This summary highlights only some of the key features and terms of the actual license. It is not a license and has no legal value. Carefully review the actual license before using these materials.
Results
CRISPRi Identifies Metabolic Genes That Influence Fosfomycin Efficacy
Figure 1
Figure 1. A CRISPRi screen identifies metabolic genes that influence the response of E. colito fosfomycin. (A) Schematic of the CRISPRi library antibiotic screen. The library containing 1,515 CRISPRi strains and controls was induced with aTc for 6.5 h and subsequently cultivated for another 24 h in medium containing 304 μg/mL fosfomycin (n = 2). (B) Response of controls (n = 16) to the addition of fosfomycin at t = 0. (C) Strains in category 2 (16 strains) have an OD decrease phase at least 2 times longer than controls (black line, n = 16). (D) Strains in category 3 (15 strains) grew like controls in the first phase (<9 h) and showed OD increases in later phases (>9 h). (E) Strains in category 4 showed increases in OD. (F) Validation of the regrowth phenotype in the pykA strain (n = 4). The black line is the mean. (G) Same as (F) for the pykF strain (n = 4). (H) Same as (F) for the atpH strain (n = 4). Note that the black line in B–E shows the same mean of controls (n = 16) as a reference.
Knockdown of Pyruvate Kinase and ATP Synthase Increases MIC
Figure 2
Figure 2. Time-kill assays and population analysis profile tests. In all graphs, empty triangles indicate one replicate below the detection limit, and filled triangles indicate all replicates below detection limits. Before treatment, all strains reached exponential growth at OD > 0.25. (A) Time-kill assay with CRISPRi strains (control, atpB, atpH, pykF, and pykA). Strains were incubated for 9 h in minimal glucose medium containing aTc and 304 μg/mL fosfomycin (n = 3). Lines indicate a mean of n = 3 replicates, and dots represent individual replicates. (B) Population analysis profile (PAP) tests of CRISPRi strains (control, atpH, and pykF) in minimal glucose medium. Strains were incubated for 24 h on minimal glucose agar plates containing aTc and increasing concentrations of fosfomycin (n = 2). Lines indicate a mean of n = 2 replicates, and dots represent individual replicates.
CRISPRi Knockdown of pykF Promotes the Evolution of a Resistance Mutation in ibaG
Figure 3
Figure 3. Response of the control strain, the pykF strain, and the atpH strain to repeated fosfomycin treatment. (A–C) The control strain (A), atpH strain (B), and pykF strain (C) were treated with 304 μg/mL fosfomycin (n = 8). Cells were collected after 9 (orange dashed line) and 24 h (blue dashed line) and recovered in drug-free, rich LB medium for 24 h. (D–F) Cells recovered after 9 h were subjected to the same fosfomycin treatment. (D) 9 h treated control, (E) 9 h treated atpH, and (F) 9 h treated pykF. (G–I) Cells recovered after 24 h were subjected to the same fosfomycin treatment. (G) 24 h treated control, (H) 24 h treated atpH, and (I) 24 h treated pykF. Lines in each graph represent different replicates. Thick dashed lines in (F) and (I) indicate the strains used for whole genome sequencing.
Figure 4
Figure 4. Point mutation in ibaG increases resistance to fosfomycin and further enhances pykF strain resistance. (A) Whole genome sequencing of pykF recovered after 24 h of treatment with fosfomycin identified the ibaGK45I mutation. (B) The ibaGK45I mutation was introduced into E. coli BW25113 with a CRISPR method. (24) (C) E. coli BW25113 strain (control with CRISPR plasmids pTS40 and pTS41), BW25113 strain with the IbaG mutation, the control CRISPRi strain, and the pykF strain recovered after 24 h of fosfomycin treatment carrying the ibaGK45I mutation were treated with the indicated concentrations of fosfomycin. All graphs show the mean of n = 8 replicates.
Increases in PEP May Undermine Fosfomycin Activity
Figure 5
Figure 5. Phosphoenolpyruvate increases in fosfomycin-treated CRISPRi strains. Strains were incubated for 3 h to OD > 0.25 in aTc-containing minimal medium before fosfomycin treatment. Metabolites were measured after 0 and 9 h of fosfomycin treatment (304 μg/mL). Bars represent the mean fold change relative to the control, and dots indicate fold changes of replicates (n = 3). Intensities were normalized to the OD. Fold changes relative to the control strain are shown for phosphoenolpyruvate (A), adenosine monophosphate (B), adenosine diphosphate (C), and adenosine triphosphate (D). Statistical significance was determined using one-sided t tests against the control strain at 0 h with p < 0.05 (*).
Knockdown of pykF and atpH Primes the CpxAR Cell Envelope Stress Response System
Figure 6
Figure 6. Transcriptome of the pykF strain and the atpH strain with and without fosfomycin. Strains were incubated for 3 h to OD > 0.25 in aTc-containing minimal medium before fosfomycin treatment. RNA sequencing was performed after 0 and 9 h of fosfomycin treatment (304 μg/mL). Fold changes were calculated relative to the mean of the untreated control strain at t = 0 h. (A) Transcript levels of the atpH strain before (0 h) and (B) after 9 h of fosfomycin treatment. (C) Transcript levels of the pykF strain before (0 h) and (D) after 9 h of fosfomycin treatment.
Discussion
Methods and Protocols
Strains
| reagent or resource | source | identifier |
|---|---|---|
| CRISPRi library in YYdCas9: BW25113 CRISPRipgRNA intC:tetR-dcas9-aadA lacY:ypet-cat | Donati et al., 2021 (20) | N/A |
| YYdCas9: BW25113 intC:tetR-dcas9-aadA lacY:ypet-cat (BW25993 intC:tetR-dcas9-aadA lacY:ypet-cat araB:T7 RNAP-tetA ΔaraB) | Lawson et al., 2017 (38) | N/A |
| BW25113:ibaGK45I | this study | N/A |
Media
Screening of Antibiotic Phenotypes of the CRISPRi Library
Generation of Growth Curves and Determination of Phenotypes
Regrowth of Fosfomycin-Treated Strains
Time-Kill Assay
Population Analysis Protocol Assay
Metabolomics of atpH, pykF, and Control Strain
Transcriptomics of the atpH, pykF, and Control Strain
Whole Genome Sequencing
Genomic Integration of ibaGK45I
Data Availability
Raw sequencing data have been deposited at NCBI in the Sequence Read Archive (SRA) under BioProject accession number PRJNA1290243 (https://www.ncbi.nlm.nih.gov/bioproject/PRJNA1290243).
Supporting Information
The Supporting Information is available free of charge at https://pubs.acs.org/doi/10.1021/acsinfecdis.5c01013.
Fosfomycin MIC determination (Figure S1); initial screen growth data of strains added for validation (Figure S2); phenotype validations under fosfomycin treatment (Figure S3); PAP of the control, atpH, and pykF strain on LB agar and at low fosfomycin concentrations (Figure S4); phenotypes detected in the antibiotic screen; strains that were not found in the initial screen but added as potentially false negatives are marked by dotted lines (Table S1) (PDF)
Source data for all the figures provided in the main text and supporting files (Table S2) (XLSX)
Terms & Conditions
Most electronic Supporting Information files are available without a subscription to ACS Web Editions. Such files may be downloaded by article for research use (if there is a public use license linked to the relevant article, that license may permit other uses). Permission may be obtained from ACS for other uses through requests via the RightsLink permission system: http://pubs.acs.org/page/copyright/permissions.html.
Author Information
- Hannes Link - Interfaculty Institute of Microbiology and Infection Medicine, University of Tübingen, 72076 Tübingen, Germany; Cluster of Excellence “Controlling Microbes to Fight Infections”, University of Tübingen, 72076 Tübingen, Germany; M3 Research Center, University of Tübingen, Otfried-Müller-Str. 37, 72076 Tübingen, Germany;
 https://orcid.org/0000-0002-6677-555X;
- Fabian Smollich - Interfaculty Institute of Microbiology and Infection Medicine, University of Tübingen, 72076 Tübingen, Germany; Cluster of Excellence “Controlling Microbes to Fight Infections”, University of Tübingen, 72076 Tübingen, Germany; M3 Research Center, University of Tübingen, Otfried-Müller-Str. 37, 72076 Tübingen, Germany;https://orcid.org/0009-0009-5048-8917
Conceptualization: A.V. and H.L.; experiments: A.V., A.S., F.S., and J.R.; analysis: A.V., A.S., J.R., D.S., H.L.; supervision: H.L.; writing─original draft: A.V. and H.L. All authors have read and agreed to the published version of the manuscript.
Acknowledgments
This article is adapted from parts of the Ph.D. dissertation of A. Verhülsdonk, University of Tübingen. (37) We thank Libera Lo Presti for discussions. This work was funded by the Deutsche Forschungsgemeinschaft (DFG, German Research Foundation) under Germanys Excellence Strategy (EXC 2124: 390838134). NGS sequencing methods were performed at the Core Facility Genomics, Medical Faculty, University Hospital Tübingen/DFG-funded NGS Competence Center NCCT Tübingen (INST 37/1049-1). Data management and storage of raw data for this project were supported by the Quantitative Biology Center (QBiC), University of Tübingen, Germany.
References
This article references 38 other publications.
- 1Khalil, I. A.; Troeger, C.; Blacker, B. F.; Rao, P. C.; Brown, A.; Atherly, D. E.; Brewer, T. G.; Engmann, C. M.; Houpt, E. R.; Kang, G.; Kotloff, K. L.; Levine, M. M.; Luby, S. P.; MacLennan, C. A.; Pan, W. K.; Pavlinac, P. B.; Platts-Mills, J. A.; Qadri, F.; Riddle, M. S.; Ryan, E. T.; Shoultz, D. A.; Steele, A. D.; Walson, J. L.; Sanders, J. W.; Mokdad, A. H.; Murray, C. J. L.; Hay, S. I.; Reiner, R. C. Morbidity and Mortality Due to Shigella and Enterotoxigenic Escherichia coli Diarrhoea: The Global Burden of Disease Study 1990–2016. Lancet Infect. Dis. 2018, 18 (11), 1229– 1240, DOI: 10.1016/S1473-3099(18)30475-4Google ScholarThere is no corresponding record for this reference.
- 2Falagas, M. E.; Vouloumanou, E. K.; Samonis, G.; Vardakas, K. Z. Fosfomycin. Clin. Microbiol. Rev. 2016, 29 (2), 321– 347, DOI: 10.1128/CMR.00068-15Google ScholarThere is no corresponding record for this reference.
- 3Silver, L. L. Fosfomycin: Mechanism and Resistance. Cold Spring Harbor Perspect. Med. 2017, 7 (2), a025262, DOI: 10.1101/cshperspect.a025262Google ScholarThere is no corresponding record for this reference.
- 4Bianchi, M.; Winterhalter, M.; Harbig, T. A.; Hörömpöli, D.; Ghai, I.; Nieselt, K.; Brötz-Oesterhelt, H.; Mayer, C.; Borisova-Mayer, M. Fosfomycin Uptake in Escherichia Coli Is Mediated by the Outer-Membrane Porins OmpF, OmpC, and LamB. ACS Infect. Dis. 2024, 10 (1), 127– 137, DOI: 10.1021/acsinfecdis.3c00367Google ScholarThere is no corresponding record for this reference.
- 5Monte, D. F. M.; Doi, Y.; Lincopan, N. High Prevalence and Global Distribution of Fosfomycin Resistance Genes in Salmonella Serovars. Lancet Microbe 2023, 4 (12), e968 DOI: 10.1016/S2666-5247(23)00261-6Google ScholarThere is no corresponding record for this reference.
- 6Kim, D. H.; Lees, W. J.; Kempsell, K. E.; Lane, W. S.; Duncan, K.; Walsh, C. T. Characterization of a Cys115 to Asp Substitution in the Escherichia coli Cell Wall Biosynthetic Enzyme UDP-GlcNAc Enolpyruvyl Transferase (MurA) That Confers Resistance to Inactivation by the Antibiotic Fosfomycin. Biochemistry 1996, 35 (15), 4923– 4928, DOI: 10.1021/bi952937wGoogle ScholarThere is no corresponding record for this reference.
- 7Dewachter, L.; Brooks, A. N.; Noon, K.; Cialek, C.; Clark-ElSayed, A.; Schalck, T.; Krishnamurthy, N.; Versées, W.; Vranken, W.; Michiels, J. Deep Mutational Scanning of Essential Bacterial Proteins Can Guide Antibiotic Development. Nat. Commun. 2023, 14 (1), 241, DOI: 10.1038/s41467-023-35940-3Google ScholarThere is no corresponding record for this reference.
- 8Dörr, T. Understanding Tolerance to Cell Wall–Active Antibiotics. Ann. N.Y. Acad. Sci. 2021, 1496 (1), 35– 58, DOI: 10.1111/nyas.14541Google ScholarThere is no corresponding record for this reference.
- 9Dewachter, L.; Fauvart, M.; Michiels, J. Bacterial Heterogeneity and Antibiotic Survival: Understanding and Combatting Persistence and Heteroresistance. Mol. Cell 2019, 76 (2), 255– 267, DOI: 10.1016/j.molcel.2019.09.028Google ScholarThere is no corresponding record for this reference.
- 10Bollen, C.; Louwagie, E.; Verstraeten, N.; Michiels, J.; Ruelens, P. Environmental, Mechanistic and Evolutionary Landscape of Antibiotic Persistence. EMBO Rep. 2023, 24 (8), e57309 DOI: 10.15252/embr.202357309Google ScholarThere is no corresponding record for this reference.
- 11Band, V. I.; Weiss, D. S. Heteroresistance to Beta-Lactam Antibiotics May Often Be a Stage in the Progression to Antibiotic Resistance. PLoS Biol. 2021, 19 (7), e3001346 DOI: 10.1371/journal.pbio.3001346Google ScholarThere is no corresponding record for this reference.
- 12Andersson, D. I.; Nicoloff, H.; Hjort, K. Mechanisms and Clinical Relevance of Bacterial Heteroresistance. Nat. Rev. Microbiol. 2019, 17 (8), 479– 496, DOI: 10.1038/s41579-019-0218-1Google ScholarThere is no corresponding record for this reference.
- 13Levin-Reisman, I.; Ronin, I.; Gefen, O.; Braniss, I.; Shoresh, N.; Balaban, N. Q. Antibiotic Tolerance Facilitates the Evolution of Resistance. Science 2017, 355 (6327), 826– 830, DOI: 10.1126/science.aaj2191Google ScholarThere is no corresponding record for this reference.
- 14Bakkeren, E.; Diard, M.; Hardt, W.-D. Evolutionary Causes and Consequences of Bacterial Antibiotic Persistence. Nat. Rev. Microbiol. 2020, 18 (9), 479– 490, DOI: 10.1038/s41579-020-0378-zGoogle ScholarThere is no corresponding record for this reference.
- 15Stokes, J. M.; Lopatkin, A. J.; Lobritz, M. A.; Collins, J. J. Bacterial Metabolism and Antibiotic Efficacy. Cell Metab. 2019, 30 (2), 251– 259, DOI: 10.1016/j.cmet.2019.06.009Google ScholarThere is no corresponding record for this reference.
- 16Ohkoshi, Y.; Sato, T.; Suzuki, Y.; Yamamoto, S.; Shiraishi, T.; Ogasawara, N.; Yokota, S. Mechanism of Reduced Susceptibility to Fosfomycin in Escherichia Coli Clinical Isolates. Biomed Res. Int. 2017, 2017, 5470241, DOI: 10.1155/2017/5470241Google ScholarThere is no corresponding record for this reference.
- 17Petek, M.; Baebler, S. ̌.; Kuzman, D.; Rotter, A.; Podlesek, Z.; Gruden, K.; Ravnikar, M.; Urleb, U. Revealing Fosfomycin Primary Effect on Staphylococcus Aureus Transcriptome: Modulation of Cell Envelope Biosynthesis and Phosphoenolpyruvate Induced Starvation. BMC Microbiol. 2010, 10 (1), 159, DOI: 10.1186/1471-2180-10-159Google ScholarThere is no corresponding record for this reference.
- 18Nilsson, A. I.; Berg, O. G.; Aspevall, O.; Kahlmeter, G.; Andersson, D. I. Biological Costs and Mechanisms of Fosfomycin Resistance in Escherichia coli. Antimicrob. Agents Chemother. 2003, 47 (9), 2850– 2858, DOI: 10.1128/AAC.47.9.2850-2858.2003Google ScholarThere is no corresponding record for this reference.
- 19Turner, A. K.; Yasir, M.; Bastkowski, S.; Telatin, A.; Page, A. J.; Charles, I. G.; Webber, M. A. A Genome-Wide Analysis of Escherichia Coli Responses to Fosfomycin Using TraDIS-Xpress Reveals Novel Roles for Phosphonate Degradation and Phosphate Transport Systems. J. Antimicrob. Chemother. 2020, 75 (11), 3144– 3151, DOI: 10.1093/jac/dkaa296Google ScholarThere is no corresponding record for this reference.
- 20Donati, S.; Kuntz, M.; Pahl, V.; Farke, N.; Beuter, D.; Glatter, T.; Gomes-Filho, J. V.; Randau, L.; Wang, C.-Y.; Link, H. Multi-Omics Analysis of CRISPRi-Knockdowns Identifies Mechanisms That Buffer Decreases of Enzymes in E. coli Metabolism. Cell Syst. 2021, 12 (1), 56– 67.e6, DOI: 10.1016/j.cels.2020.10.011Google ScholarThere is no corresponding record for this reference.
- 21Monk, J. M.; Lloyd, C. J.; Brunk, E.; Mih, N.; Sastry, A.; King, Z.; Takeuchi, R.; Nomura, W.; Zhang, Z.; Mori, H.; Feist, A. M.; Palsson, B. O. iML1515, a Knowledgebase That Computes Escherichia Coli Traits. Nat. Biotechnol. 2017, 35 (10), 904– 908, DOI: 10.1038/nbt.3956Google ScholarThere is no corresponding record for this reference.
- 22Zhao, C.; Lin, Z.; Dong, H.; Zhang, Y.; Li, Y. Reexamination of the Physiological Role of PykA in Escherichia Coli Revealed That It Negatively Regulates the Intracellular ATP Levels under Anaerobic Conditions. Appl. Environ. Microbiol. 2017, 83 (11), e00316–17 DOI: 10.1128/AEM.00316-17Google ScholarThere is no corresponding record for this reference.
- 23Gil-Gil, T.; Martínez, J. L. Fosfomycin Resistance Evolutionary Pathways of Stenotrophomonas Maltophilia in Different Growing Conditions. Int. J. Mol. Sci. 2022, 23 (3), 1132, DOI: 10.3390/ijms23031132Google ScholarThere is no corresponding record for this reference.
- 24Garst, A. D.; Bassalo, M. C.; Pines, G.; Lynch, S. A.; Halweg-Edwards, A. L.; Liu, R.; Liang, L.; Wang, Z.; Zeitoun, R.; Alexander, W. G.; Gill, R. T. Genome-Wide Mapping of Mutations at Single-Nucleotide Resolution for Protein, Metabolic and Genome Engineering. Nat. Biotechnol. 2017, 35 (1), 48– 55, DOI: 10.1038/nbt.3718Google ScholarThere is no corresponding record for this reference.
- 25Lubrano, P.; Smollich, F.; Schramm, T.; Lorenz, E.; Alvarado, A.; Eigenmann, S. C.; Stadelmann, A.; Thavapalan, S.; Waffenschmidt, N.; Glatter, T. Metabolic Mutations Reduce Antibiotic Susceptibility of E. coli by Pathway-Specific Bottlenecks. Mol. Syst. Biol. 2025, 21 (3), 274– 293, DOI: 10.1038/s44320-024-00084-zGoogle ScholarThere is no corresponding record for this reference.
- 26Skarzynski, T.; Mistry, A.; Wonacott, A.; Hutchinson, S. E.; Kelly, V. A.; Duncan, K. Structure of UDP-N-Acetylglucosamine Enolpyruvyl Transferase, an Enzyme Essential for the Synthesis of Bacterial Peptidoglycan, Complexed with Substrate UDP-N-Acetylglucosamine and the Drug Fosfomycin. Structure 1996, 4 (12), 1465– 1474, DOI: 10.1016/S0969-2126(96)00153-0Google ScholarThere is no corresponding record for this reference.
- 27Zhao, Z.; Xu, Y.; Jiang, B.; Qi, Q.; Tang, Y.-J.; Xian, M.; Wang, J.; Zhao, G. Systematic Identification of CpxRA-Regulated Genes and Their Roles in Escherichia coli Stress Response. mSystems 2022, 7 (5), e00419–22 DOI: 10.1128/msystems.00419-22Google ScholarThere is no corresponding record for this reference.
- 28Silvis, M. R.; Rajendram, M.; Shi, H.; Osadnik, H.; Gray, A. N.; Cesar, S.; Peters, J. M.; Hearne, C. C.; Kumar, P.; Todor, H.; Huang, K. C.; Gross, C. A. Morphological and Transcriptional Responses to CRISPRi Knockdown of Essential Genes in Escherichia coli. mBio 2021, 12 (5), e0256121 DOI: 10.1128/mBio.02561-21Google ScholarThere is no corresponding record for this reference.
- 29Ewels, P. A.; Peltzer, A.; Fillinger, S.; Patel, H.; Alneberg, J.; Wilm, A.; Garcia, M. U.; Di Tommaso, P.; Nahnsen, S. The Nf-Core Framework for Community-Curated Bioinformatics Pipelines. Nat. Biotechnol. 2020, 38 (3), 276– 278, DOI: 10.1038/s41587-020-0439-xGoogle ScholarThere is no corresponding record for this reference.
- 30Di Tommaso, P.; Chatzou, M.; Floden, E. W.; Barja, P. P.; Palumbo, E.; Notredame, C. Nextflow Enables Reproducible Computational Workflows. Nat. Biotechnol. 2017, 35 (4), 316– 319, DOI: 10.1038/nbt.3820Google ScholarThere is no corresponding record for this reference.
- 31Kurtzer, G. M.; Sochat, V.; Bauer, M. W. Singularity: Scientific Containers for Mobility of Compute. PLoS One 2017, 12 (5), e0177459 DOI: 10.1371/journal.pone.0177459Google ScholarThere is no corresponding record for this reference.
- 32Kopylova, E.; Noé, L.; Touzet, H. SortMeRNA: Fast and Accurate Filtering of Ribosomal RNAs in Metatranscriptomic Data. Bioinformatics 2012, 28 (24), 3211– 3217, DOI: 10.1093/bioinformatics/bts611Google ScholarThere is no corresponding record for this reference.
- 33Patro, R.; Duggal, G.; Love, M. I.; Irizarry, R. A.; Kingsford, C. Salmon Provides Fast and Bias-Aware Quantification of Transcript Expression. Nat. Methods 2017, 14 (4), 417– 419, DOI: 10.1038/nmeth.4197Google ScholarThere is no corresponding record for this reference.
- 34Hanssen, F.; Garcia, M. U.; Folkersen, L.; Pedersen, A. S.; Lescai, F.; Jodoin, S.; Miller, E.; Seybold, M.; Wacker, O.; Smith, N.; Gabernet, G.; Nahnsen, S. Scalable and Efficient DNA Sequencing Analysis on Different Compute Infrastructures Aiding Variant Discovery. NAR Genomics Bioinf. 2024, 6 (2), lqae031, DOI: 10.1093/nargab/lqae031Google ScholarThere is no corresponding record for this reference.
- 35Chen, S.; Zhou, Y.; Chen, Y.; Gu, J. Fastp: An Ultra-Fast All-in-One FASTQ Preprocessor. Bioinformatics 2018, 34 (17), i884– i890, DOI: 10.1093/bioinformatics/bty560Google ScholarThere is no corresponding record for this reference.
- 36Kim, S.; Scheffler, K.; Halpern, A. L.; Bekritsky, M. A.; Noh, E.; Källberg, M.; Chen, X.; Kim, Y.; Beyter, D.; Krusche, P.; Saunders, C. T. Strelka2: Fast and Accurate Calling of Germline and Somatic Variants. Nat. Methods 2018, 15 (8), 591– 594, DOI: 10.1038/s41592-018-0051-xGoogle ScholarThere is no corresponding record for this reference.
- 37Verhülsdonk, A. A Metabolism-Wide genus-speciesE. coligenus-species CRISPRi Library to Screen Antibiotic Susceptibility and Metabolome Responses, Ph.D. Dissertation; University of Tübingen, 2025. http://hdl.handle.net/10900/173090.Google ScholarThere is no corresponding record for this reference.
- 38Lawson, M. J; Camsund, D.; Larsson, J.; Baltekin, O.; Fange, D.; Elf, J. In Situ Genotyping of a Pooled Strain Library after Characterizing Complex Phenotypes. Molecular Systems Biology 2017, 13 (10), 947, DOI: 10.15252/msb.20177951Google ScholarThere is no corresponding record for this reference.
Cited By
This article has not yet been cited by other publications.

ACS Infectious Diseases
Copyright © 2026 The Authors. Published by American Chemical Society. This publication is licensed under
License Summary*
You are free to share (copy and redistribute) this article in any medium or format and to adapt (remix, transform, and build upon) the material for any purpose, even commercially within the parameters below:
Creative Commons (CC): This is a Creative Commons license.
Attribution (BY): Credit must be given to the creator.
*Disclaimer
This summary highlights only some of the key features and terms of the actual license. It is not a license and has no legal value. Carefully review the actual license before using these materials.
Article Views
Altmetric
Citations
Article Views are the COUNTER-compliant sum of full text article downloads since November 2008 (both PDF and HTML) across all institutions and individuals. These metrics are regularly updated to reflect usage leading up to the last few days.
Citations are the number of other articles citing this article, calculated by Crossref and updated daily. Find more information about Crossref citation counts.
The Altmetric Attention Score is a quantitative measure of the attention that a research article has received online. Clicking on the donut icon will load a page at altmetric.com with additional details about the score and the social media presence for the given article. Find more information on the Altmetric Attention Score and how the score is calculated.
Recommended Articles
Abstract

Figure 1
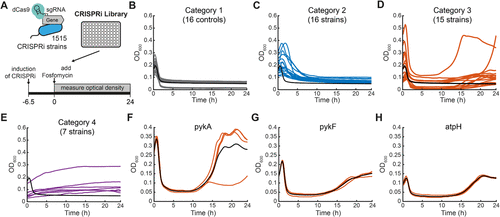
Figure 1. A CRISPRi screen identifies metabolic genes that influence the response of E. colito fosfomycin. (A) Schematic of the CRISPRi library antibiotic screen. The library containing 1,515 CRISPRi strains and controls was induced with aTc for 6.5 h and subsequently cultivated for another 24 h in medium containing 304 μg/mL fosfomycin (n = 2). (B) Response of controls (n = 16) to the addition of fosfomycin at t = 0. (C) Strains in category 2 (16 strains) have an OD decrease phase at least 2 times longer than controls (black line, n = 16). (D) Strains in category 3 (15 strains) grew like controls in the first phase (<9 h) and showed OD increases in later phases (>9 h). (E) Strains in category 4 showed increases in OD. (F) Validation of the regrowth phenotype in the pykA strain (n = 4). The black line is the mean. (G) Same as (F) for the pykF strain (n = 4). (H) Same as (F) for the atpH strain (n = 4). Note that the black line in B–E shows the same mean of controls (n = 16) as a reference.
Figure 2
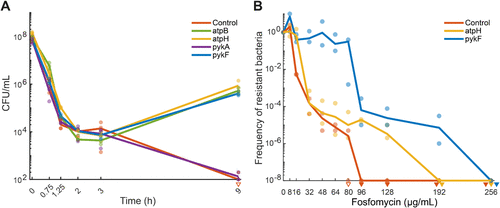
Figure 2. Time-kill assays and population analysis profile tests. In all graphs, empty triangles indicate one replicate below the detection limit, and filled triangles indicate all replicates below detection limits. Before treatment, all strains reached exponential growth at OD > 0.25. (A) Time-kill assay with CRISPRi strains (control, atpB, atpH, pykF, and pykA). Strains were incubated for 9 h in minimal glucose medium containing aTc and 304 μg/mL fosfomycin (n = 3). Lines indicate a mean of n = 3 replicates, and dots represent individual replicates. (B) Population analysis profile (PAP) tests of CRISPRi strains (control, atpH, and pykF) in minimal glucose medium. Strains were incubated for 24 h on minimal glucose agar plates containing aTc and increasing concentrations of fosfomycin (n = 2). Lines indicate a mean of n = 2 replicates, and dots represent individual replicates.
Figure 3
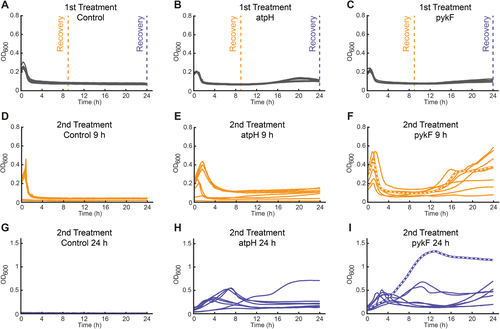
Figure 3. Response of the control strain, the pykF strain, and the atpH strain to repeated fosfomycin treatment. (A–C) The control strain (A), atpH strain (B), and pykF strain (C) were treated with 304 μg/mL fosfomycin (n = 8). Cells were collected after 9 (orange dashed line) and 24 h (blue dashed line) and recovered in drug-free, rich LB medium for 24 h. (D–F) Cells recovered after 9 h were subjected to the same fosfomycin treatment. (D) 9 h treated control, (E) 9 h treated atpH, and (F) 9 h treated pykF. (G–I) Cells recovered after 24 h were subjected to the same fosfomycin treatment. (G) 24 h treated control, (H) 24 h treated atpH, and (I) 24 h treated pykF. Lines in each graph represent different replicates. Thick dashed lines in (F) and (I) indicate the strains used for whole genome sequencing.
Figure 4

Figure 4. Point mutation in ibaG increases resistance to fosfomycin and further enhances pykF strain resistance. (A) Whole genome sequencing of pykF recovered after 24 h of treatment with fosfomycin identified the ibaGK45I mutation. (B) The ibaGK45I mutation was introduced into E. coli BW25113 with a CRISPR method. (24) (C) E. coli BW25113 strain (control with CRISPR plasmids pTS40 and pTS41), BW25113 strain with the IbaG mutation, the control CRISPRi strain, and the pykF strain recovered after 24 h of fosfomycin treatment carrying the ibaGK45I mutation were treated with the indicated concentrations of fosfomycin. All graphs show the mean of n = 8 replicates.
Figure 5
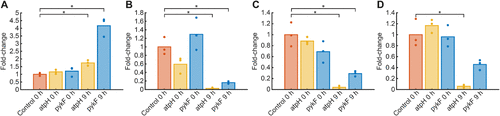
Figure 5. Phosphoenolpyruvate increases in fosfomycin-treated CRISPRi strains. Strains were incubated for 3 h to OD > 0.25 in aTc-containing minimal medium before fosfomycin treatment. Metabolites were measured after 0 and 9 h of fosfomycin treatment (304 μg/mL). Bars represent the mean fold change relative to the control, and dots indicate fold changes of replicates (n = 3). Intensities were normalized to the OD. Fold changes relative to the control strain are shown for phosphoenolpyruvate (A), adenosine monophosphate (B), adenosine diphosphate (C), and adenosine triphosphate (D). Statistical significance was determined using one-sided t tests against the control strain at 0 h with p < 0.05 (*).
Figure 6

Figure 6. Transcriptome of the pykF strain and the atpH strain with and without fosfomycin. Strains were incubated for 3 h to OD > 0.25 in aTc-containing minimal medium before fosfomycin treatment. RNA sequencing was performed after 0 and 9 h of fosfomycin treatment (304 μg/mL). Fold changes were calculated relative to the mean of the untreated control strain at t = 0 h. (A) Transcript levels of the atpH strain before (0 h) and (B) after 9 h of fosfomycin treatment. (C) Transcript levels of the pykF strain before (0 h) and (D) after 9 h of fosfomycin treatment.
References
This article references 38 other publications.
- 1Khalil, I. A.; Troeger, C.; Blacker, B. F.; Rao, P. C.; Brown, A.; Atherly, D. E.; Brewer, T. G.; Engmann, C. M.; Houpt, E. R.; Kang, G.; Kotloff, K. L.; Levine, M. M.; Luby, S. P.; MacLennan, C. A.; Pan, W. K.; Pavlinac, P. B.; Platts-Mills, J. A.; Qadri, F.; Riddle, M. S.; Ryan, E. T.; Shoultz, D. A.; Steele, A. D.; Walson, J. L.; Sanders, J. W.; Mokdad, A. H.; Murray, C. J. L.; Hay, S. I.; Reiner, R. C. Morbidity and Mortality Due to Shigella and Enterotoxigenic Escherichia coli Diarrhoea: The Global Burden of Disease Study 1990–2016. Lancet Infect. Dis. 2018, 18 (11), 1229– 1240, DOI: 10.1016/S1473-3099(18)30475-4There is no corresponding record for this reference.
- 2Falagas, M. E.; Vouloumanou, E. K.; Samonis, G.; Vardakas, K. Z. Fosfomycin. Clin. Microbiol. Rev. 2016, 29 (2), 321– 347, DOI: 10.1128/CMR.00068-15There is no corresponding record for this reference.
- 3Silver, L. L. Fosfomycin: Mechanism and Resistance. Cold Spring Harbor Perspect. Med. 2017, 7 (2), a025262, DOI: 10.1101/cshperspect.a025262There is no corresponding record for this reference.
- 4Bianchi, M.; Winterhalter, M.; Harbig, T. A.; Hörömpöli, D.; Ghai, I.; Nieselt, K.; Brötz-Oesterhelt, H.; Mayer, C.; Borisova-Mayer, M. Fosfomycin Uptake in Escherichia Coli Is Mediated by the Outer-Membrane Porins OmpF, OmpC, and LamB. ACS Infect. Dis. 2024, 10 (1), 127– 137, DOI: 10.1021/acsinfecdis.3c00367There is no corresponding record for this reference.
- 5Monte, D. F. M.; Doi, Y.; Lincopan, N. High Prevalence and Global Distribution of Fosfomycin Resistance Genes in Salmonella Serovars. Lancet Microbe 2023, 4 (12), e968 DOI: 10.1016/S2666-5247(23)00261-6There is no corresponding record for this reference.
- 6Kim, D. H.; Lees, W. J.; Kempsell, K. E.; Lane, W. S.; Duncan, K.; Walsh, C. T. Characterization of a Cys115 to Asp Substitution in the Escherichia coli Cell Wall Biosynthetic Enzyme UDP-GlcNAc Enolpyruvyl Transferase (MurA) That Confers Resistance to Inactivation by the Antibiotic Fosfomycin. Biochemistry 1996, 35 (15), 4923– 4928, DOI: 10.1021/bi952937wThere is no corresponding record for this reference.
- 7Dewachter, L.; Brooks, A. N.; Noon, K.; Cialek, C.; Clark-ElSayed, A.; Schalck, T.; Krishnamurthy, N.; Versées, W.; Vranken, W.; Michiels, J. Deep Mutational Scanning of Essential Bacterial Proteins Can Guide Antibiotic Development. Nat. Commun. 2023, 14 (1), 241, DOI: 10.1038/s41467-023-35940-3There is no corresponding record for this reference.
- 8Dörr, T. Understanding Tolerance to Cell Wall–Active Antibiotics. Ann. N.Y. Acad. Sci. 2021, 1496 (1), 35– 58, DOI: 10.1111/nyas.14541There is no corresponding record for this reference.
- 9Dewachter, L.; Fauvart, M.; Michiels, J. Bacterial Heterogeneity and Antibiotic Survival: Understanding and Combatting Persistence and Heteroresistance. Mol. Cell 2019, 76 (2), 255– 267, DOI: 10.1016/j.molcel.2019.09.028There is no corresponding record for this reference.
- 10Bollen, C.; Louwagie, E.; Verstraeten, N.; Michiels, J.; Ruelens, P. Environmental, Mechanistic and Evolutionary Landscape of Antibiotic Persistence. EMBO Rep. 2023, 24 (8), e57309 DOI: 10.15252/embr.202357309There is no corresponding record for this reference.
- 11Band, V. I.; Weiss, D. S. Heteroresistance to Beta-Lactam Antibiotics May Often Be a Stage in the Progression to Antibiotic Resistance. PLoS Biol. 2021, 19 (7), e3001346 DOI: 10.1371/journal.pbio.3001346There is no corresponding record for this reference.
- 12Andersson, D. I.; Nicoloff, H.; Hjort, K. Mechanisms and Clinical Relevance of Bacterial Heteroresistance. Nat. Rev. Microbiol. 2019, 17 (8), 479– 496, DOI: 10.1038/s41579-019-0218-1There is no corresponding record for this reference.
- 13Levin-Reisman, I.; Ronin, I.; Gefen, O.; Braniss, I.; Shoresh, N.; Balaban, N. Q. Antibiotic Tolerance Facilitates the Evolution of Resistance. Science 2017, 355 (6327), 826– 830, DOI: 10.1126/science.aaj2191There is no corresponding record for this reference.
- 14Bakkeren, E.; Diard, M.; Hardt, W.-D. Evolutionary Causes and Consequences of Bacterial Antibiotic Persistence. Nat. Rev. Microbiol. 2020, 18 (9), 479– 490, DOI: 10.1038/s41579-020-0378-zThere is no corresponding record for this reference.
- 15Stokes, J. M.; Lopatkin, A. J.; Lobritz, M. A.; Collins, J. J. Bacterial Metabolism and Antibiotic Efficacy. Cell Metab. 2019, 30 (2), 251– 259, DOI: 10.1016/j.cmet.2019.06.009There is no corresponding record for this reference.
- 16Ohkoshi, Y.; Sato, T.; Suzuki, Y.; Yamamoto, S.; Shiraishi, T.; Ogasawara, N.; Yokota, S. Mechanism of Reduced Susceptibility to Fosfomycin in Escherichia Coli Clinical Isolates. Biomed Res. Int. 2017, 2017, 5470241, DOI: 10.1155/2017/5470241There is no corresponding record for this reference.
- 17Petek, M.; Baebler, S. ̌.; Kuzman, D.; Rotter, A.; Podlesek, Z.; Gruden, K.; Ravnikar, M.; Urleb, U. Revealing Fosfomycin Primary Effect on Staphylococcus Aureus Transcriptome: Modulation of Cell Envelope Biosynthesis and Phosphoenolpyruvate Induced Starvation. BMC Microbiol. 2010, 10 (1), 159, DOI: 10.1186/1471-2180-10-159There is no corresponding record for this reference.
- 18Nilsson, A. I.; Berg, O. G.; Aspevall, O.; Kahlmeter, G.; Andersson, D. I. Biological Costs and Mechanisms of Fosfomycin Resistance in Escherichia coli. Antimicrob. Agents Chemother. 2003, 47 (9), 2850– 2858, DOI: 10.1128/AAC.47.9.2850-2858.2003There is no corresponding record for this reference.
- 19Turner, A. K.; Yasir, M.; Bastkowski, S.; Telatin, A.; Page, A. J.; Charles, I. G.; Webber, M. A. A Genome-Wide Analysis of Escherichia Coli Responses to Fosfomycin Using TraDIS-Xpress Reveals Novel Roles for Phosphonate Degradation and Phosphate Transport Systems. J. Antimicrob. Chemother. 2020, 75 (11), 3144– 3151, DOI: 10.1093/jac/dkaa296There is no corresponding record for this reference.
- 20Donati, S.; Kuntz, M.; Pahl, V.; Farke, N.; Beuter, D.; Glatter, T.; Gomes-Filho, J. V.; Randau, L.; Wang, C.-Y.; Link, H. Multi-Omics Analysis of CRISPRi-Knockdowns Identifies Mechanisms That Buffer Decreases of Enzymes in E. coli Metabolism. Cell Syst. 2021, 12 (1), 56– 67.e6, DOI: 10.1016/j.cels.2020.10.011There is no corresponding record for this reference.
- 21Monk, J. M.; Lloyd, C. J.; Brunk, E.; Mih, N.; Sastry, A.; King, Z.; Takeuchi, R.; Nomura, W.; Zhang, Z.; Mori, H.; Feist, A. M.; Palsson, B. O. iML1515, a Knowledgebase That Computes Escherichia Coli Traits. Nat. Biotechnol. 2017, 35 (10), 904– 908, DOI: 10.1038/nbt.3956There is no corresponding record for this reference.
- 22Zhao, C.; Lin, Z.; Dong, H.; Zhang, Y.; Li, Y. Reexamination of the Physiological Role of PykA in Escherichia Coli Revealed That It Negatively Regulates the Intracellular ATP Levels under Anaerobic Conditions. Appl. Environ. Microbiol. 2017, 83 (11), e00316–17 DOI: 10.1128/AEM.00316-17There is no corresponding record for this reference.
- 23Gil-Gil, T.; Martínez, J. L. Fosfomycin Resistance Evolutionary Pathways of Stenotrophomonas Maltophilia in Different Growing Conditions. Int. J. Mol. Sci. 2022, 23 (3), 1132, DOI: 10.3390/ijms23031132There is no corresponding record for this reference.
- 24Garst, A. D.; Bassalo, M. C.; Pines, G.; Lynch, S. A.; Halweg-Edwards, A. L.; Liu, R.; Liang, L.; Wang, Z.; Zeitoun, R.; Alexander, W. G.; Gill, R. T. Genome-Wide Mapping of Mutations at Single-Nucleotide Resolution for Protein, Metabolic and Genome Engineering. Nat. Biotechnol. 2017, 35 (1), 48– 55, DOI: 10.1038/nbt.3718There is no corresponding record for this reference.
- 25Lubrano, P.; Smollich, F.; Schramm, T.; Lorenz, E.; Alvarado, A.; Eigenmann, S. C.; Stadelmann, A.; Thavapalan, S.; Waffenschmidt, N.; Glatter, T. Metabolic Mutations Reduce Antibiotic Susceptibility of E. coli by Pathway-Specific Bottlenecks. Mol. Syst. Biol. 2025, 21 (3), 274– 293, DOI: 10.1038/s44320-024-00084-zThere is no corresponding record for this reference.
- 26Skarzynski, T.; Mistry, A.; Wonacott, A.; Hutchinson, S. E.; Kelly, V. A.; Duncan, K. Structure of UDP-N-Acetylglucosamine Enolpyruvyl Transferase, an Enzyme Essential for the Synthesis of Bacterial Peptidoglycan, Complexed with Substrate UDP-N-Acetylglucosamine and the Drug Fosfomycin. Structure 1996, 4 (12), 1465– 1474, DOI: 10.1016/S0969-2126(96)00153-0There is no corresponding record for this reference.
- 27Zhao, Z.; Xu, Y.; Jiang, B.; Qi, Q.; Tang, Y.-J.; Xian, M.; Wang, J.; Zhao, G. Systematic Identification of CpxRA-Regulated Genes and Their Roles in Escherichia coli Stress Response. mSystems 2022, 7 (5), e00419–22 DOI: 10.1128/msystems.00419-22There is no corresponding record for this reference.
- 28Silvis, M. R.; Rajendram, M.; Shi, H.; Osadnik, H.; Gray, A. N.; Cesar, S.; Peters, J. M.; Hearne, C. C.; Kumar, P.; Todor, H.; Huang, K. C.; Gross, C. A. Morphological and Transcriptional Responses to CRISPRi Knockdown of Essential Genes in Escherichia coli. mBio 2021, 12 (5), e0256121 DOI: 10.1128/mBio.02561-21There is no corresponding record for this reference.
- 29Ewels, P. A.; Peltzer, A.; Fillinger, S.; Patel, H.; Alneberg, J.; Wilm, A.; Garcia, M. U.; Di Tommaso, P.; Nahnsen, S. The Nf-Core Framework for Community-Curated Bioinformatics Pipelines. Nat. Biotechnol. 2020, 38 (3), 276– 278, DOI: 10.1038/s41587-020-0439-xThere is no corresponding record for this reference.
- 30Di Tommaso, P.; Chatzou, M.; Floden, E. W.; Barja, P. P.; Palumbo, E.; Notredame, C. Nextflow Enables Reproducible Computational Workflows. Nat. Biotechnol. 2017, 35 (4), 316– 319, DOI: 10.1038/nbt.3820There is no corresponding record for this reference.
- 31Kurtzer, G. M.; Sochat, V.; Bauer, M. W. Singularity: Scientific Containers for Mobility of Compute. PLoS One 2017, 12 (5), e0177459 DOI: 10.1371/journal.pone.0177459There is no corresponding record for this reference.
- 32Kopylova, E.; Noé, L.; Touzet, H. SortMeRNA: Fast and Accurate Filtering of Ribosomal RNAs in Metatranscriptomic Data. Bioinformatics 2012, 28 (24), 3211– 3217, DOI: 10.1093/bioinformatics/bts611There is no corresponding record for this reference.
- 33Patro, R.; Duggal, G.; Love, M. I.; Irizarry, R. A.; Kingsford, C. Salmon Provides Fast and Bias-Aware Quantification of Transcript Expression. Nat. Methods 2017, 14 (4), 417– 419, DOI: 10.1038/nmeth.4197There is no corresponding record for this reference.
- 34Hanssen, F.; Garcia, M. U.; Folkersen, L.; Pedersen, A. S.; Lescai, F.; Jodoin, S.; Miller, E.; Seybold, M.; Wacker, O.; Smith, N.; Gabernet, G.; Nahnsen, S. Scalable and Efficient DNA Sequencing Analysis on Different Compute Infrastructures Aiding Variant Discovery. NAR Genomics Bioinf. 2024, 6 (2), lqae031, DOI: 10.1093/nargab/lqae031There is no corresponding record for this reference.
- 35Chen, S.; Zhou, Y.; Chen, Y.; Gu, J. Fastp: An Ultra-Fast All-in-One FASTQ Preprocessor. Bioinformatics 2018, 34 (17), i884– i890, DOI: 10.1093/bioinformatics/bty560There is no corresponding record for this reference.
- 36Kim, S.; Scheffler, K.; Halpern, A. L.; Bekritsky, M. A.; Noh, E.; Källberg, M.; Chen, X.; Kim, Y.; Beyter, D.; Krusche, P.; Saunders, C. T. Strelka2: Fast and Accurate Calling of Germline and Somatic Variants. Nat. Methods 2018, 15 (8), 591– 594, DOI: 10.1038/s41592-018-0051-xThere is no corresponding record for this reference.
- 37Verhülsdonk, A. A Metabolism-Wide genus-speciesE. coligenus-species CRISPRi Library to Screen Antibiotic Susceptibility and Metabolome Responses, Ph.D. Dissertation; University of Tübingen, 2025. http://hdl.handle.net/10900/173090.There is no corresponding record for this reference.
- 38Lawson, M. J; Camsund, D.; Larsson, J.; Baltekin, O.; Fange, D.; Elf, J. In Situ Genotyping of a Pooled Strain Library after Characterizing Complex Phenotypes. Molecular Systems Biology 2017, 13 (10), 947, DOI: 10.15252/msb.20177951There is no corresponding record for this reference.
Supporting Information
Supporting Information
The Supporting Information is available free of charge at https://pubs.acs.org/doi/10.1021/acsinfecdis.5c01013.
Fosfomycin MIC determination (Figure S1); initial screen growth data of strains added for validation (Figure S2); phenotype validations under fosfomycin treatment (Figure S3); PAP of the control, atpH, and pykF strain on LB agar and at low fosfomycin concentrations (Figure S4); phenotypes detected in the antibiotic screen; strains that were not found in the initial screen but added as potentially false negatives are marked by dotted lines (Table S1) (PDF)
Source data for all the figures provided in the main text and supporting files (Table S2) (XLSX)
Terms & Conditions
Most electronic Supporting Information files are available without a subscription to ACS Web Editions. Such files may be downloaded by article for research use (if there is a public use license linked to the relevant article, that license may permit other uses). Permission may be obtained from ACS for other uses through requests via the RightsLink permission system: http://pubs.acs.org/page/copyright/permissions.html.